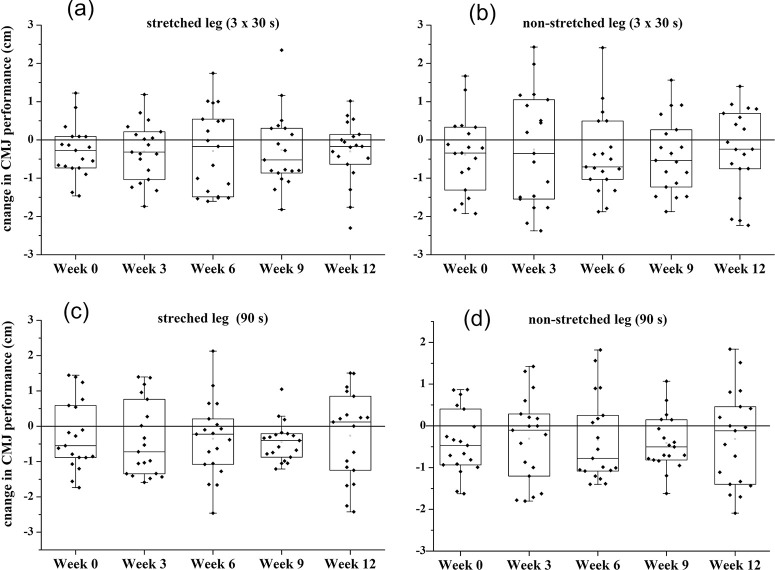
FIG. 4.
Box-plots showing the change in CMJ performance (post-stretching minus pre-stretching values) for the stretching group over the course of training (Week 0 to Week 9) and detraining (Week 12), for the repeated bouts (3 x 30 s, panel a and b) and the single stretching protocol (90 s, panel c and d). Measurements of the control leg were taken without any stretching intervention. Individual values are represented as dots.

