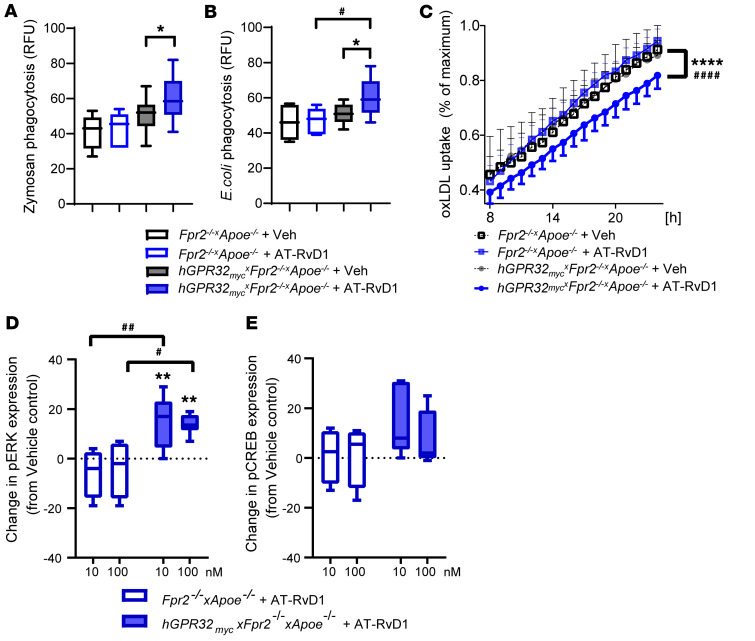
Figure 5. AT-RvD1 alters leukocyte responses and regulates phosphorylation of ERK1/2 in hGPR32mycTg×Fpr2–/–×Apoe–/– but not Fpr2–/–×Apoe–/– mice.
Naive resident peritoneal macrophages were isolated and seeded in a 96-well plate (0.1 × 10⁶ cells/well). Uptake of pH-rodo labeled (A) zymosan (n = 6) or (B) E. coli (n = 10) by peritoneal macrophages from Fpr2–/–×Apoe–/– (open boxes) and hGPR32mycTg×Fpr2–/–×Apoe–/– (filled boxes) that were pretreated with vehicle (black outline) or AT-RvD1 (100 nM, 15 minutes, 37°C; blue outline) followed by 60 minutes of incubation with the phagocytic stimuli. Results are expressed as relative fluorescence units (RFU). (C) Peritoneal macrophages were preincubated with AT-RvD1 (100 nM, 15 minutes, 37°C) followed by the addition of FITC-labeled oxLDL (10 μg/ml) to assess phagocytosis of oxLDL. Images were recorded every 1 hour for a total of 24 hours. Data are presented as percentages of maximum phagocytosis (after 24 hours). Results are expressed as mean ± SEM. Changes in (D) pERK and (E) pCREB activation in peritoneal macrophages treated with AT-RvD1 (10 or 100 nM; 5 minutes, 37°C) from vehicle control in Fpr2–/–×Apoe–/– (open box, n = 4) and hGPR32mycTg×Fpr2–/–×Apoe–/– (filled box, n = 6) mice. Results are expressed as median with minimum to maximum bars. *P < 0.05; **P < 0.01; ****P < 0.0001 vs. vehicle-treated hGPR32mycTg×Fpr2–/–×Apoe–/– macrophages. #P < 0.05; ##P < 0.01; ####P < 0.0001 in AT-RvD1–treated Fpr2–/–×Apoe–/– vs. AT-RvD1–treated hGPR32mycTg×Fpr2–/–×Apoe–/– macrophages; 2-way ANOVA.

