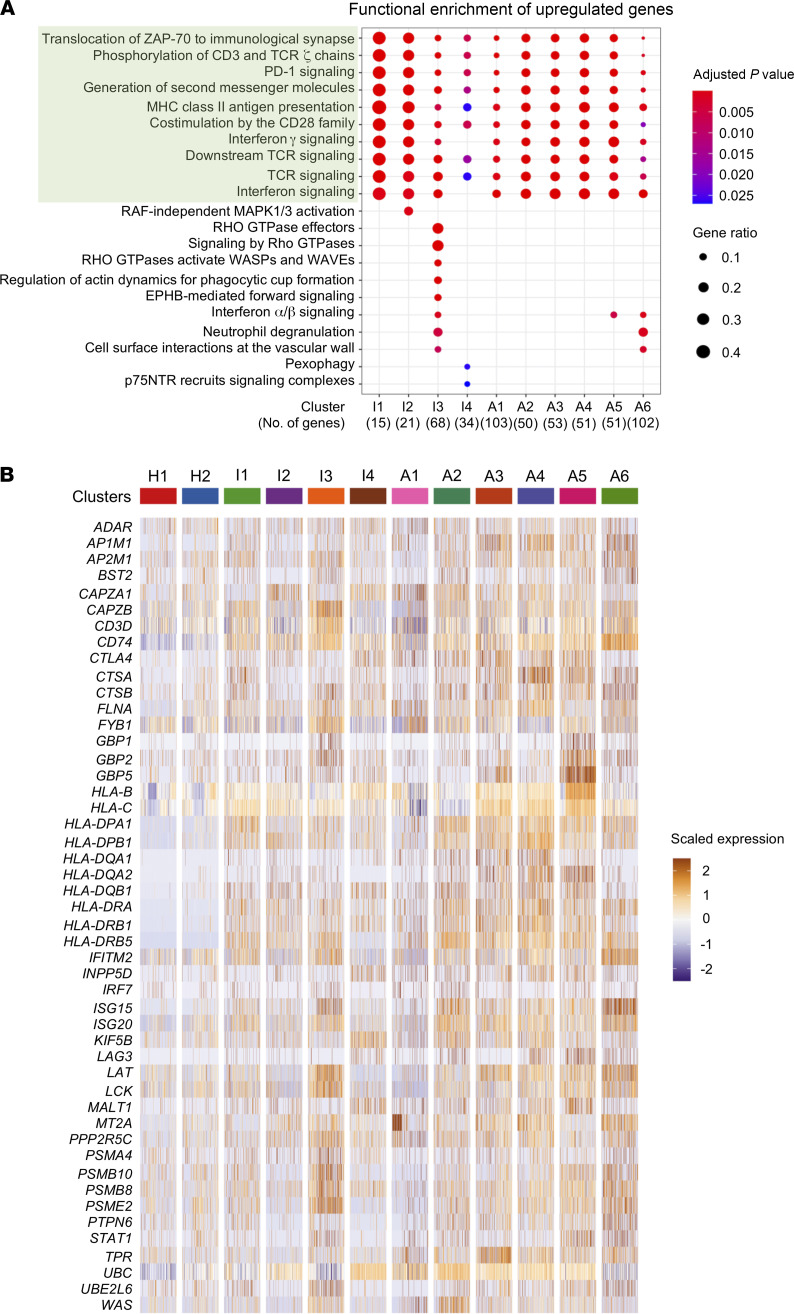
Figure 2. HTLV-1–infected and ATL cells upregulate HLA class II gene expression.
(A) Dot plot shows the shared and distinct reactome pathways of the upregulated genes for each infected cluster. Common pathways between all clusters are highlighted in green. (B) Heatmap shows the expression of the genes participating in the common pathways (highlighted in green in A) for all clusters.

