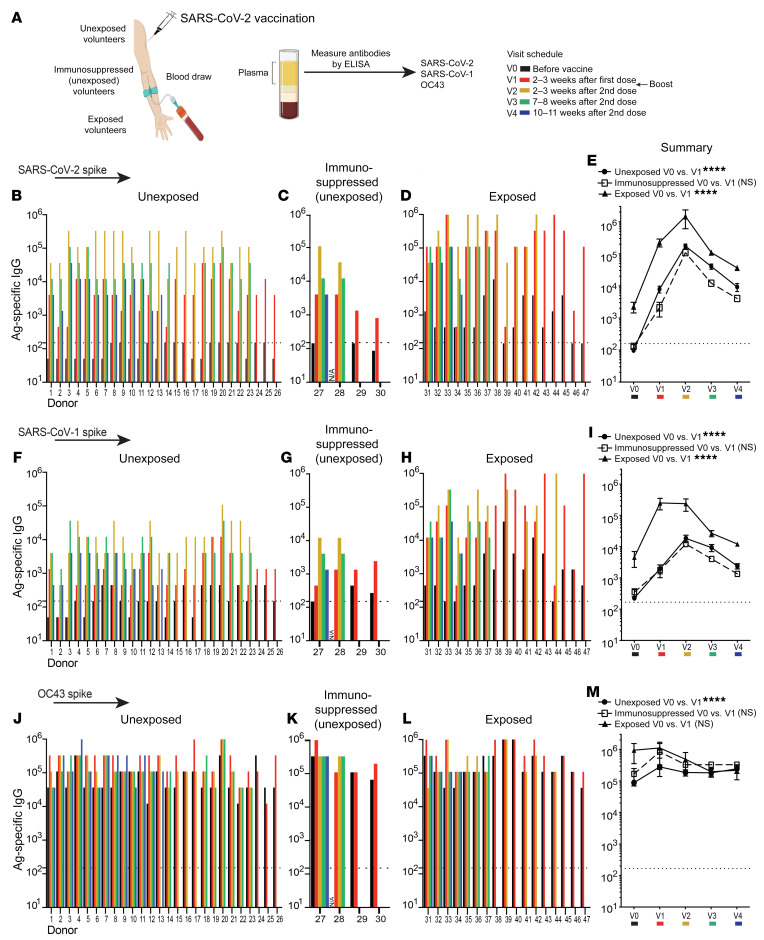
Figure 1. Cross-reactive antibody responses following SARS-CoV-2 vaccination.
Antibody responses after SARS-CoV-2 vaccination. (A) Participants 1–17, 24–29, and 31–47 received the Pfizer/BioNTek vaccine; participants 18–23 received the Moderna vaccine; and participant 30 received the Johnson & Johnson vaccine. Participants were determined to be unexposed (participants 1–26) prior to vaccination on the basis of a negative serology test for SARS-CoV-2 spike and nucleocapsid proteins before vaccination (0–7 days prior to vaccination). Participants 27–30 were unexposed, under immunosuppressive regimens, and did not interrupt their treatments at the time of vaccination (treatments for participant 27: azathioprine and prednisone; participant 28: anti–IL-6 monoclonal antibody; participant 29: prednisone; and participant 30: methotrexate). Exposed participants 31–47 tested positive for SARS-CoV-2 by RT-PCR prior to vaccination. SARS-CoV-2 spike–specific antibody responses after vaccination in (B) unexposed, (C) unexposed immunosuppressed, and (D) exposed participants. (E) Summary of SARS-CoV-2 spike antibody responses. SARS-CoV-1 spike–specific antibody responses after vaccination in (F) unexposed, (G) unexposed immunosuppressed, and (H) exposed participants. (I) Summary of SARS-CoV-1 spike antibody responses. OC43 spike–specific antibody responses after vaccination in (J) unexposed, (K) unexposed immunosuppressed, and (L) exposed participants. (M) Summary of OC43 spike antibody responses. The y axis indicates the endpoint titer (the highest plasma dilution at which the absorbance was greater than 2 times that of the negative controls: human pre-2019 plasma; see Methods). Data shown are from an ongoing longitudinal study, in which participants were vaccinated on different dates, hence the heterogeneity in the available time points after infection. Antibody responses were evaluated by ELISA. Dashed lines represent the LOD. In panels E, I, and M, the indicated P values compare V0 and V1 from each group by paired Wilcoxon test. ****P < 0.0001, by paired Wilcoxon test (P > 0.05, NS). All participants except participant 28 (lack of V0 data) were included in the analysis. Error bars indicate the SEM.

