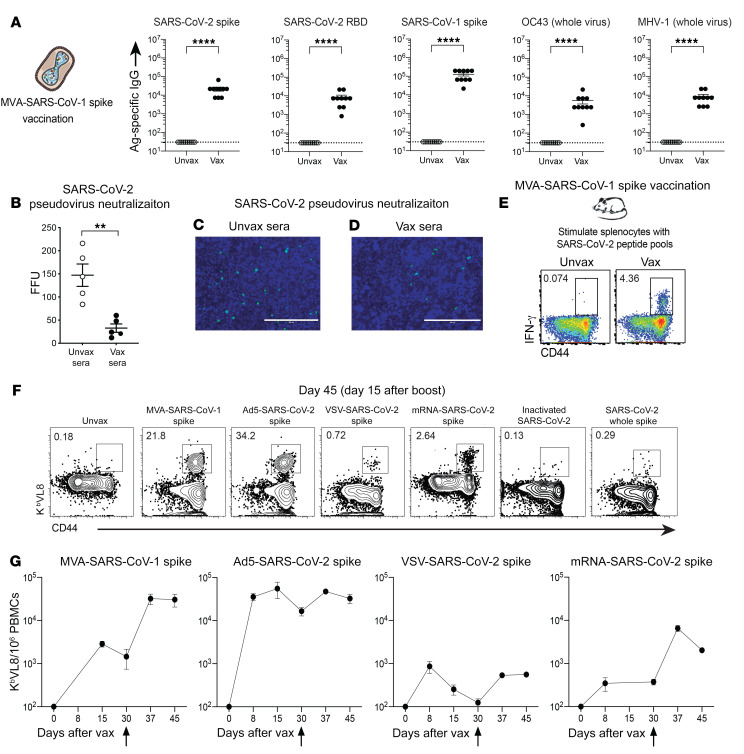
Figure 4. SARS-CoV-1 vaccination induces cross-reactive antibodies and T cells.
(A) Antibody responses after MVA-SARS-CoV-1 spike vaccination. (B) SARS-CoV-2 pseudovirus neutralization assay. SARS-CoV-2 pseudoviruses (200 FFU) were incubated with mouse sera diluted 1:4 prior to addition onto a HEK293-hACE2 cell monolayer. (C and D) Representative microscopic images of SARS-CoV-2 pseudovirus neutralization using sera from (C) unvaccinated mice (Unvax sera) or (D) SARS-CoV-1–vaccinated (Vax sera) mice. Scale bars: 400 μm. (E) Representative FACS plots showing cross-reactive SARS-CoV-2–specific CD8+ T cells in SARS-CoV-1–vaccinated mice. Cross-reactive CD8+ T cells were detected by intracellular cytokine staining after a 5-hour stimulation with SARS-CoV-2 spike overlapping peptide pools, in a 37°C, 5% CO2 incubator. Cells were gated on live CD8+ lymphocytes. Data are from splenocytes on post-boost day 15. (F) Representative FACS plots showing cross-reactive (VNFNFNGL-specific) CD8+ T cells in mice vaccinated with a SARS-CoV-1 vaccine and in mice vaccinated with various other SARS-CoV-2 vaccines. Cells were gated on live CD8+ lymphocytes. Data are from PBMCs on post-boost day 15. (G) Summary of CD8+ T cell responses among vaccine platforms. All mice were primed and boosted intramuscularly (see Methods for vaccine dosing information). Vertical arrows in G indicate the time of the boost. Experiments were done using wild-type C57BL/6 mice, except for VSV-SARS-CoV-2 spike vaccination, in which k18-hACE2 (C57BL/6) mice were used. In A, data are from 2 independent experiments with 5 mice/group; data from all experiments are shown, and dashed lines represent the LOD. In B, data are from 1 experiment with 5 mice/group. In E and F, representative results of experiments performed twice with 5 mice/group are shown. Panel G shows a summary of the 2 experiments combined. **P < 0.01 and ****P < 0.0001, by Mann-Whitney U test. Error bars indicate the SEM.

