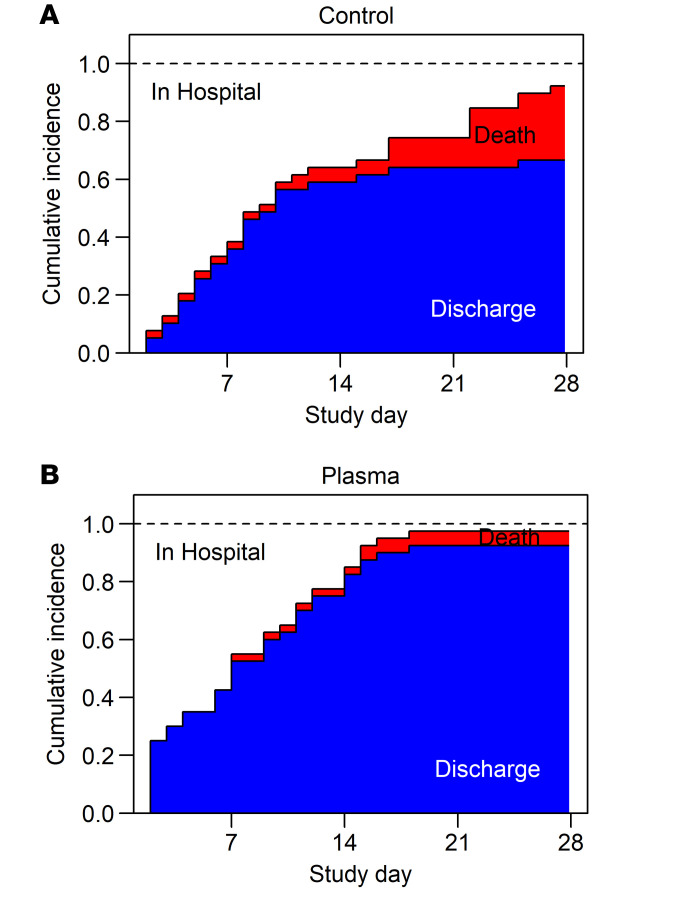
Figure 2. Stacked cumulative incidence curves.
Incidence curves for the competing risks of remaining hospitalized, death, or discharge are shown over time, censored at 28 days for the control (A) and treatment arm (B) of the 79 participants of the ITT cohort. Deaths are shaded red and discharges blue. One participant who withdrew at day of discharge (day 9) is assumed to have survived 28 days.

