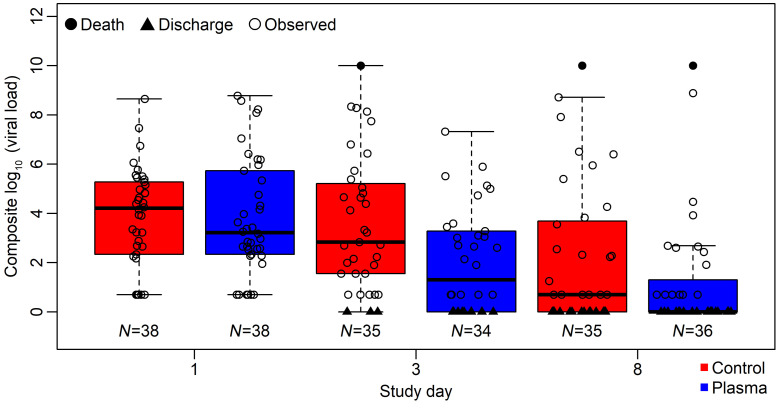
Figure 3. Composite endpoint assessing respiratory sample viral load and clinical status, in which those who were discharged had the lowest score and those who died had the highest.
Control (red) and plasma (blue) arms are shown for baseline (prior to plasma administration) and study days 3 and 8. Imputed values are shown in filled symbols and measured virus levels are shown in open circles. Values were not significantly different at baseline and were significantly lower in treatment arm at day 3 (P = 0.0128 by Wilcoxon rank sum test).

