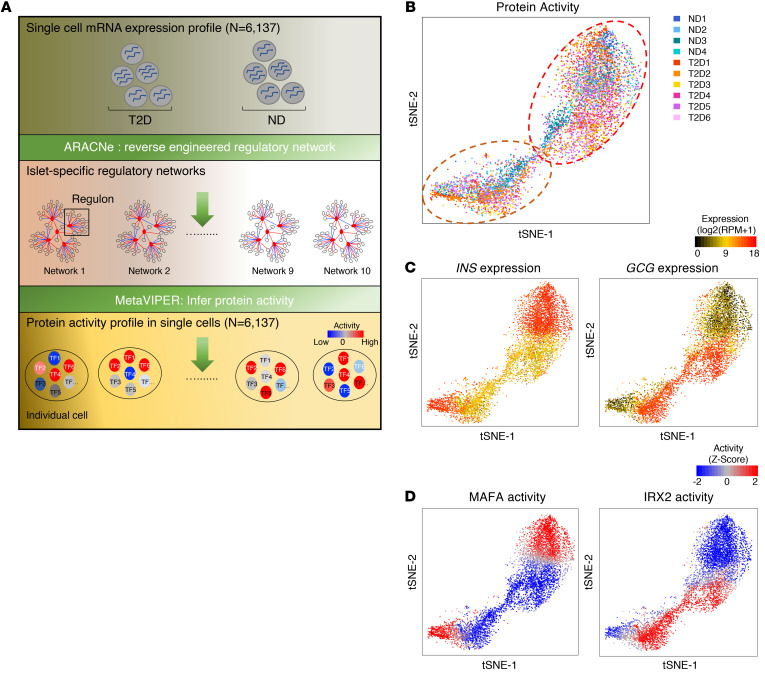
Figure 1. metaViper analysis buffers donor-to-donor variability.
(A) Schematic workflow of islet-specific regulatory network generation (ARACNe) and protein activity analyses (metaVIPER) at the single-cell level from sc-RNA-Seq data. (B) Single cells from human ND and T2D islets were projected onto 2D t-SNE space based on protein activity inferred from islet-specific regulatory networks. Each dot represents a single cell, color coded according to donor. (C) INS (insulin) and GCG (glucagon) mRNA expression plotted in t-SNE at the single-cell level. RPM, reads per million mapped reads. (D) Computationally inferred MAFA and IRX2 protein activity plotted in t-SNE at the single-cell level.

