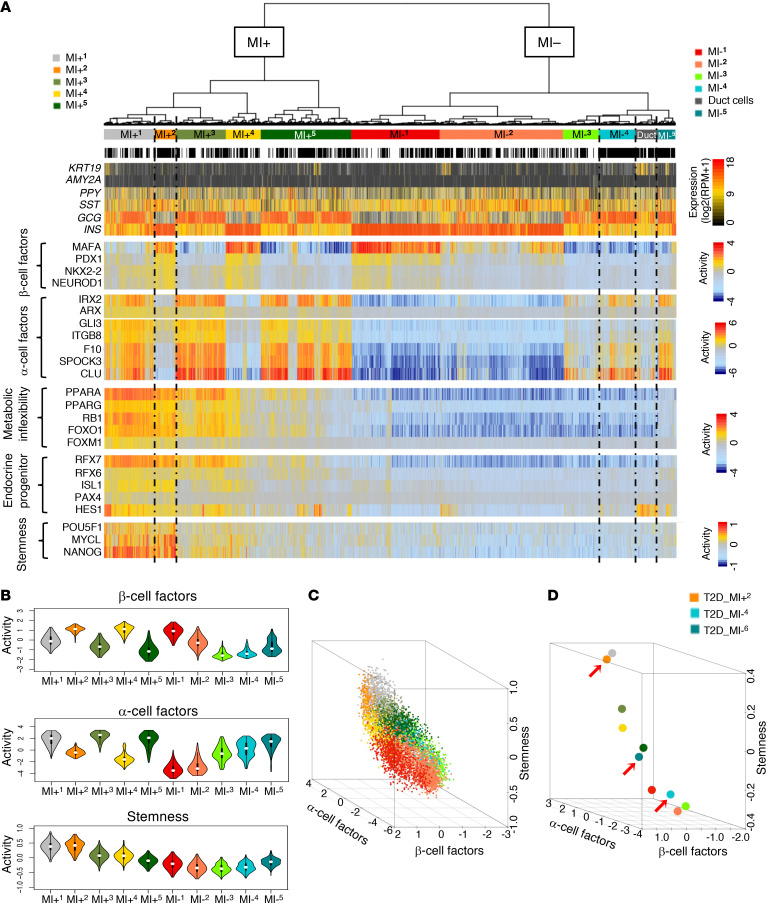
Figure 2. iterClust classifies ND and T2D islet cells into different biological states.
(A) iterClust analyses performed using ND and T2D islet cells. The resulting cluster architecture was visualized as a heatmap. Each subgroup is color coded. Each bar denotes a single cell. Black bars represent T2D cells and white bars ND cells. KRT19, AMY2A, PPY, SST, GCG, and INS mRNA expression is plotted at the single-cell level. metaViper-inferred protein activity for β or α cell factors, metabolic inflexibility, endocrine progenitor, and stemness markers is plotted at the single-cell level. RPM, reads per million mapped reads. (B) Violin plots showing the distribution of cells in each cluster based on integrated activity of β cell factors (top), α cell factors (middle), or stemness markers (bottom). (C) 3D plot showing integrated β cell factor, α cell factor, and stemness activity on the x, y, and z axes, respectively, at the single-cell level. (D) 3D plot as in C but based on the average cell behaviors of each cluster. Red arrows indicate T2D-enriched clusters, MI+2 (T2D-β-like) and MI–4 and MI–5 (both T2D-α-like).

