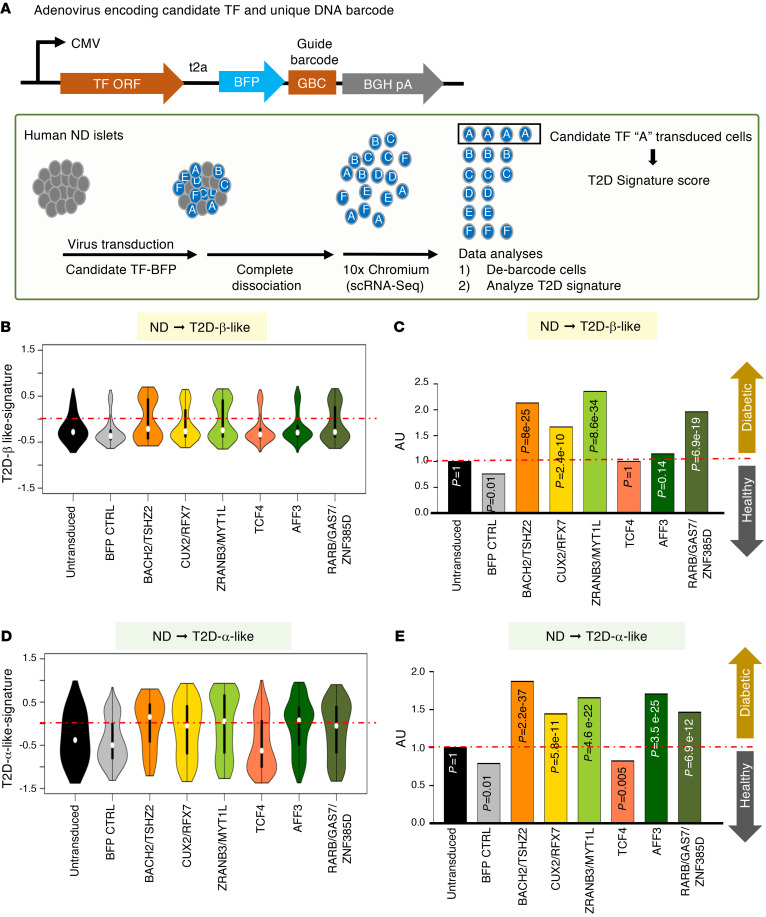
Figure 4. scGOF-Seq experiments in human islets.
(A) Schematic drawing of scGOF-Seq plasmids and experimental procedure. ND islets (ND5) were used for this experiment. (B) Violin plots showing the distribution of cells following transduction with each individual candidate or combination thereof analyzed according to T2D-β-like signature, an integrated value of RFX6, RFX7, FOXO1, PPARα, PPARγ, RB1, POU5F1, NANOG, and MYCL protein activities. Nontransduced and BFP-transduced ND islets serve as negative controls. (C) Bar plots showing the normalized proportion of islet cells with a positive T2D-β-like signature (activity > 0) in each scGOF-Seq condition over nontransduced control. (D) Violin plots showing cells with a T2D-α-like signature, which is an integrated value of IRX2, ZNHIT1, ZFPL1, PAX6, and DRAP1. (E) Bar plots showing the normalized proportion of islet cells with a T2D-α-like signature as in B. P values in C and E were derived from Fisher’s exact test.

