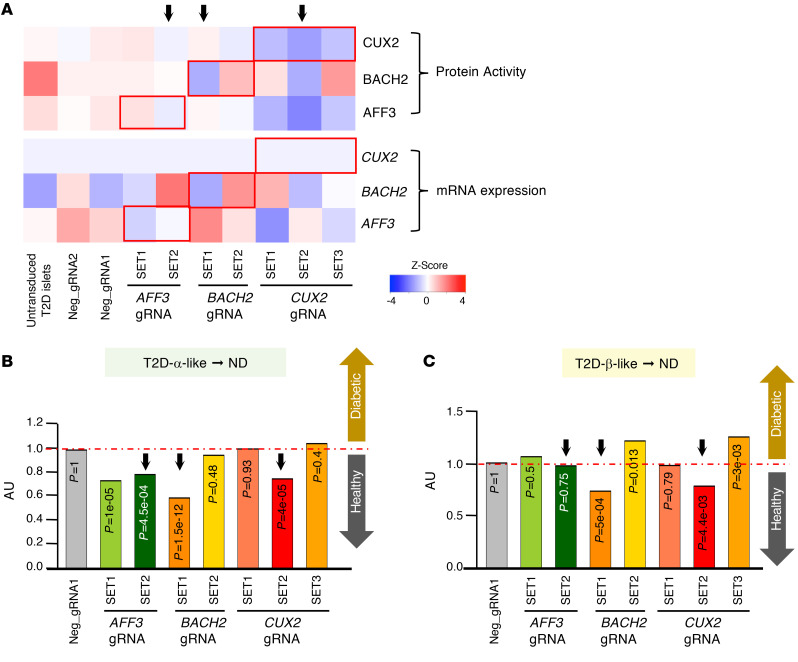
Figure 5. Perturb-Seq experiments in human T2D islets.
(A) Heatmap showing protein activity and mRNA expression of master regulators (MRs) in Perturb-Seq analyses. Black arrows indicate the strongest knockout efficiency in each Perturb-Seq condition. T2D islets (T2D7) were used for this experiment. (B) Bar plots showing the normalized proportion of islet cells with a positive T2D-α-like signature, an integrated value of IRX2, ZNHIT1, ZFPL1, PAX6, and DRAP1 (activity > 0) in each Perturb-Seq condition. (C) Bar plots showing the normalized proportion of islet cells with a T2D-β-like signature, which is an integrated value of RFX6, RFX7, FOXO1, PPARα, PPARγ, RB1, POU5F1, NANOG, and MYCL protein activities.

