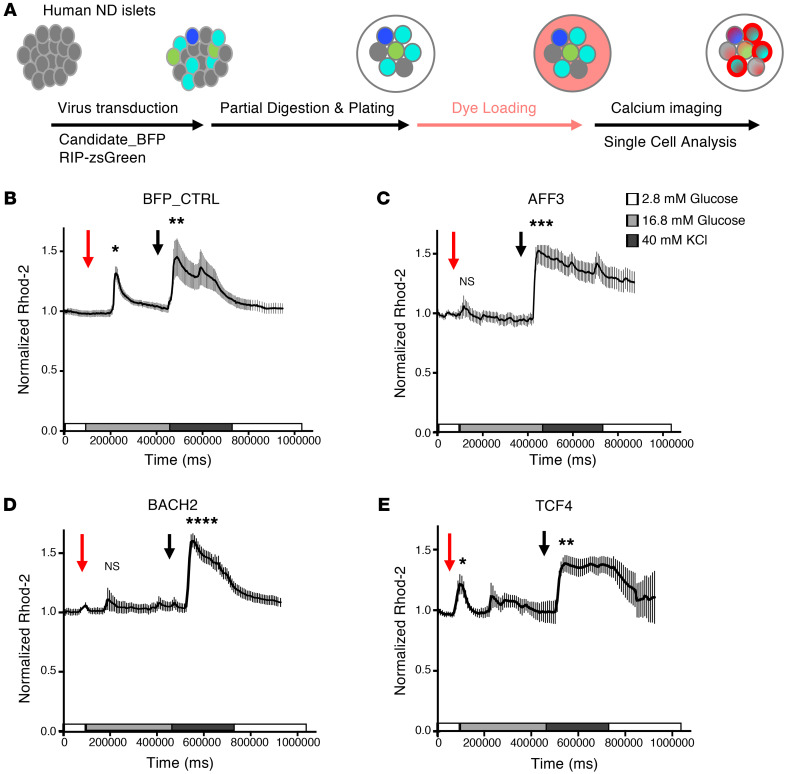
Figure 6. Single–β cell calcium microfluorimetry.
(A) Schematic drawing of the single-cell Ca2+ imaging procedure. (B–E) Representative traces of Ca2+ flux measured by Rhod-2 loading in Ad-BFP– (B), Ad-AFF3– (C), Ad-BACH2– (D), or Ad-TCF4–transduced (E) primary human β cells from 3 technical repeats using 2 ND donors (ND7 and ND8). Red arrows indicate the timing of addition of 16.8 mM glucose, and black arrows indicate addition of 40 mM KCl. *P < 0.05, **P < 0.01, ***P < 0.001, ****P < 0.0001 by ANOVA with Dunnett’s method.

