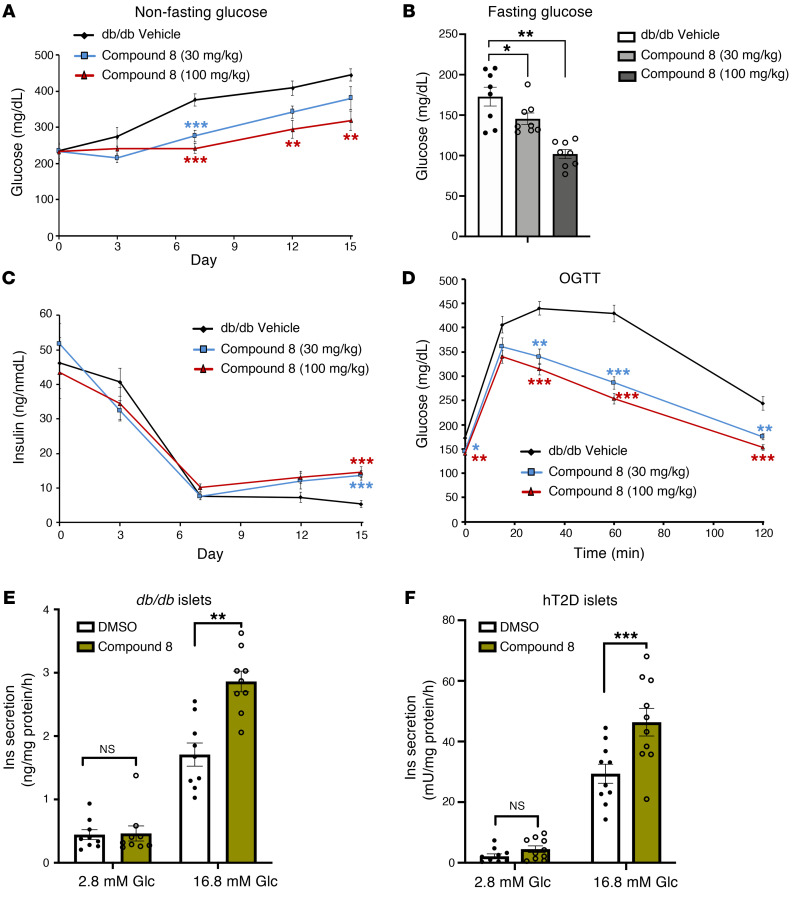
Figure 8. The effect of BACH2 inhibitor treatment in diabetic mouse models.
(A) Nonfasting blood glucose levels in male db/db mice treated with compound 8 or vehicle control throughout 2 weeks of treatment. (B) Overnight-fasted glucose levels in db/db mice after 2 weeks of compound 8 treatment. (C) Plasma insulin levels in db/db mice treated with compound 8 as in A. (D) Oral glucose-tolerance test (OGTT) in db/db mice treated with compound 8 or vehicle control (n = 8 mice per group). (E) Insulin secretion at 2.8 mM or 16.8 mM glucose in islets isolated from db/db mice following 24 hours of treatment with 1 μM compound 8 (n = 10 per group). (F) Insulin secretion as in E but in hT2D islets (n = 10 per group, T2D8 and T2D9). All data are expressed as mean ± SEM. *P < 0.05; **P < 0.01; ***P < 0.001 by ANOVA with Dunnett’s method performed between the 2 groups.

