Figure 2.

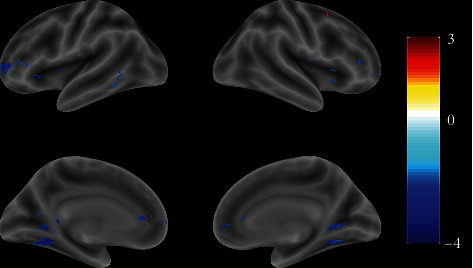
Full view of the brain response differences between the exercise and control groups after visual stimuli (t-value map). The color bar on the right side indicates the brain activity level.

Full view of the brain response differences between the exercise and control groups after visual stimuli (t-value map). The color bar on the right side indicates the brain activity level.