Figure 2.

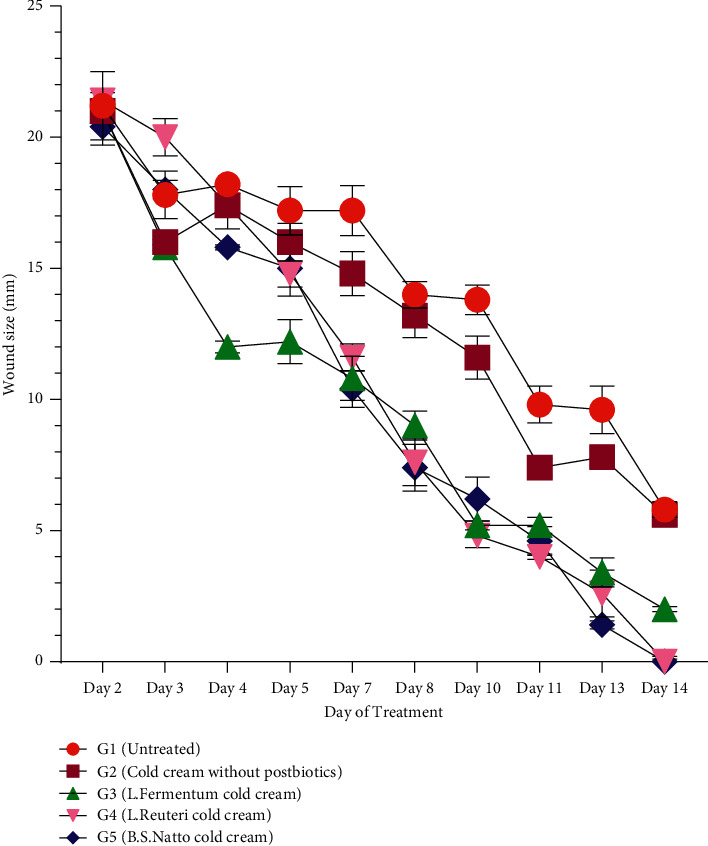
Wound sizes (mm) following treatment of different rat groups (G1 to G5) with various formulations. Data are expressed as mean ± SD (standard deviation).

Wound sizes (mm) following treatment of different rat groups (G1 to G5) with various formulations. Data are expressed as mean ± SD (standard deviation).