
Figure 3.
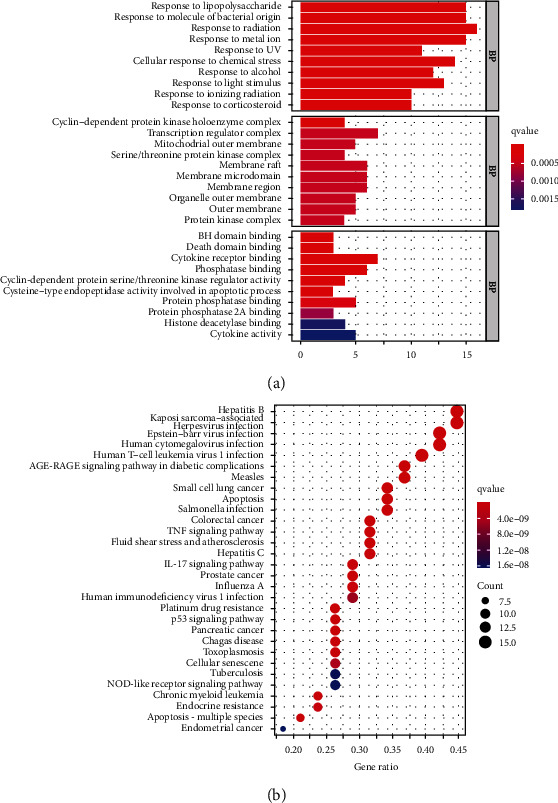
GO biological function enrichment bar chart (a) and KEGG pathway enrichment analysis bubble diagram (b).
Official websites use .gov
A
.gov website belongs to an official
government organization in the United States.
Secure .gov websites use HTTPS
A lock (
) or https:// means you've safely
connected to the .gov website. Share sensitive
information only on official, secure websites.
GO biological function enrichment bar chart (a) and KEGG pathway enrichment analysis bubble diagram (b).