
Figure 6.
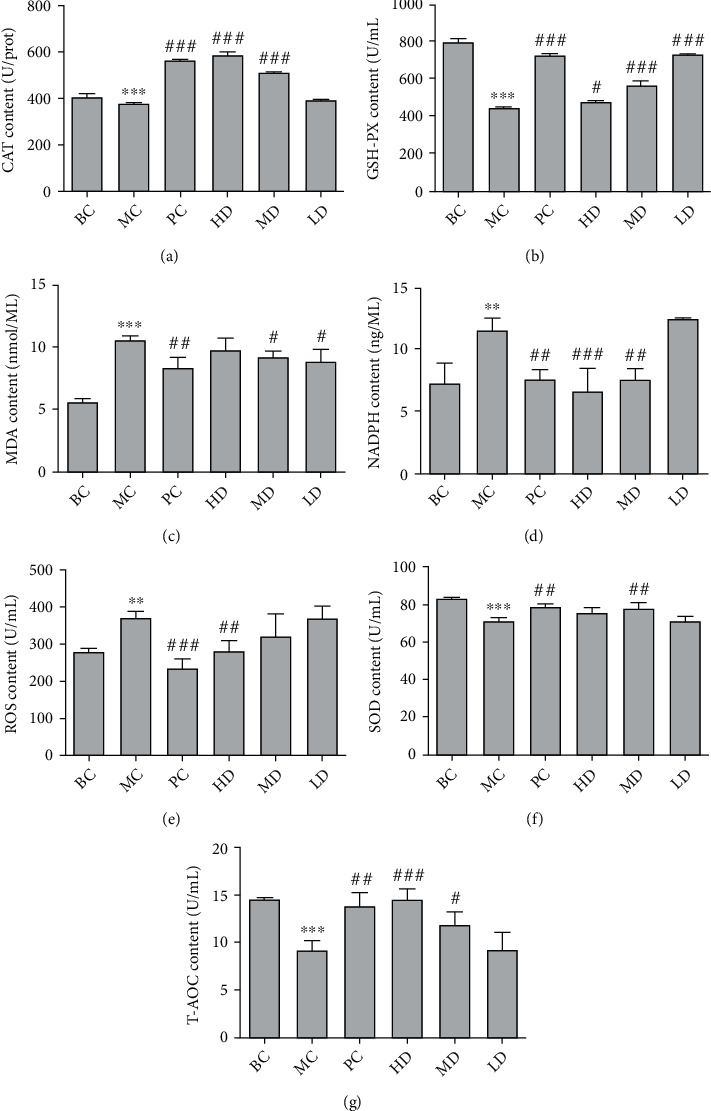
Effect of GPE on the levels of CAT (a), GSH-PX (b), MDA (c), NADPH (d), ROS (e), SOD (f), and T-AOC (g) in hyperuricemic rats. Compared with BC, ∗P < 0.05, ∗∗P < 0.01, ∗∗∗P < 0.001; compared with MC, #P < 0.05, ##P < 0.01, ###P < 0.001.
Official websites use .gov
A
.gov website belongs to an official
government organization in the United States.
Secure .gov websites use HTTPS
A lock (
) or https:// means you've safely
connected to the .gov website. Share sensitive
information only on official, secure websites.
Effect of GPE on the levels of CAT (a), GSH-PX (b), MDA (c), NADPH (d), ROS (e), SOD (f), and T-AOC (g) in hyperuricemic rats. Compared with BC, ∗P < 0.05, ∗∗P < 0.01, ∗∗∗P < 0.001; compared with MC, #P < 0.05, ##P < 0.01, ###P < 0.001.