
Figure 2.
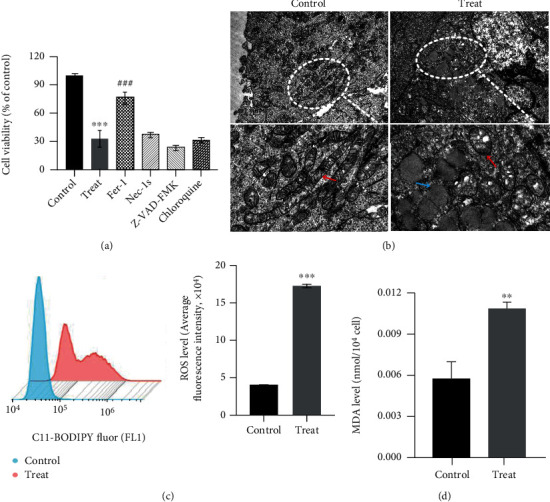
Cysteine depletion induces ferroptosis in K562/G01 but not K562 cells. (a) K562/G01 cells were treated with Fer-1 (2 μM), Nec-1s (10 μM), Z-VAD-FMK (10 μM), or chloroquine (25 μM) cultured in normal or cysteine depletion condition for 24 h. Cell viability was measured using the MTS kit. (b) TEM images showed the cell ultrastructure changes of K562/G01 cells cultured in normal or cysteine depletion condition for 24 h (scale bar = 1 μm). (c) Flow cytometry detected the ROS level of K562/G01 cells cultured in normal or cysteine depletion condition for 24 h. (d) The levels of MDA were tested in K562/G01 cells cultured in normal or cysteine depletion condition for 24 h. Fer-1 represents for ferrostatin-1; Nec-1s represents for necrostatin-1s; control represents for normal condition (0.0652 g/L cysteine). Treat represents for cysteine depletion condition (0 g/L cysteine). Red arrow: mitochondria. Blue arrow: lipid droplets. Experiments were repeated three times, and the data are expressed as the mean ± SEM. ∗∗P < 0.01 vs. control group, ∗∗∗P < 0.001 vs. control group, and ###P < 0.001 vs. treat group.