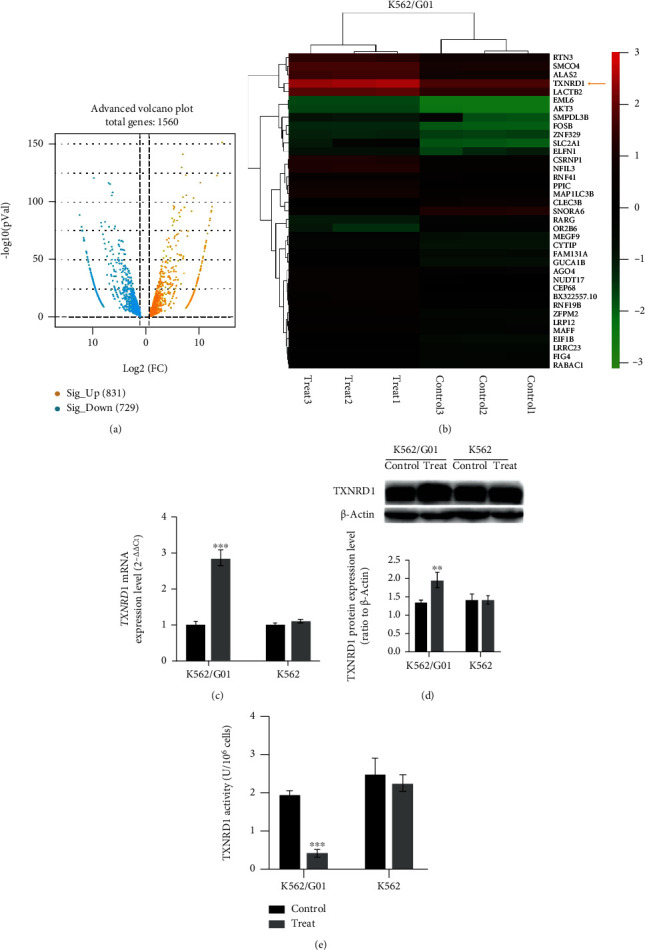
Figure 4.

Cysteine depletion can obviously feedback increase TXNRD1 expression in K562/G01 cells. (a) Volcano map of differential genes of K562/G01 between the control group and the cysteine depletion group. (b) Heat map of differential gene cluster analysis. Each column represents an experimental sample, and each row represents a gene. Expression differences are shown in different colors. Red means high expression and green means low expression. (c) TXNRD1 mRNA expression level of K562/G01 and K562 cells cultured in normal or cysteine depletion condition for 24 h. (d) TXNRD1 protein expression level of K562/G01 and K562 cells cultured in normal or cysteine depletion condition for 24 h. (e) The activity of TXNRD1 was tested of K562/G01 and K562 cells cultured in normal or cysteine depletion condition for 24 h. Control represents for normal condition (0.0652 g/L cysteine). Treat represents for cysteine depletion condition (0 g/L cysteine). Experiments were repeated three times, and the data are expressed as the mean ± SEM. ∗∗P < 0.01 vs. control group and ∗∗∗P < 0.001 vs. control group.
