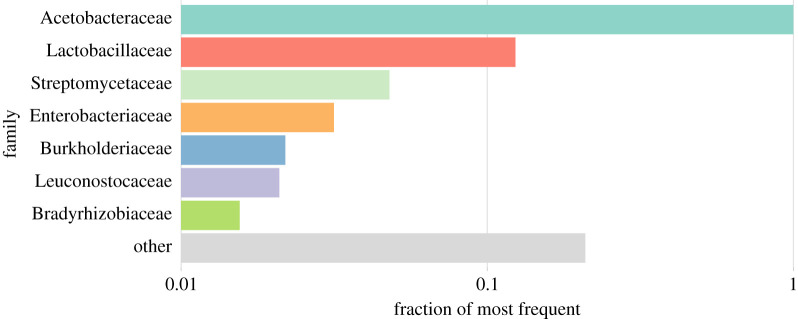
Figure 1.
Microbial diversity is dominated by seven bacterial families. Analogous to rank-abundance plots, the relative frequencies of reads classified to the most common families are shown. All frequencies are scaled to the frequency of the Acetobacteraceae, the overall most common family (which thus has a value of 1). The colour coding used here applies to all figures throughout the entire manuscript. The seven most abundant families account for at least 74% of all read pairs in each of the 81 samples. (Online version in colour.)

