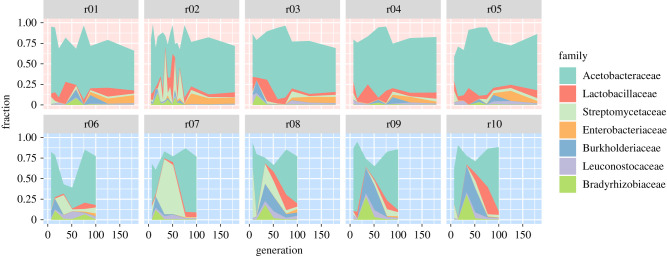
Figure 2.
Replicate dynamics reveal characteristic features for each environment. Stacked coloured areas indicate the fraction of the respective family in the given generation in each replicate in the hot (upper row, red background) and cold (lower row, blue background) environment, linearly interpolating between sampled generations (9–17 per replicate in the hot environment, 51 in total; 6 per replicate in the cold environment, 30 in total). Only the seven most abundant families (table 1 and figure 1) are shown. (Online version in colour.)

