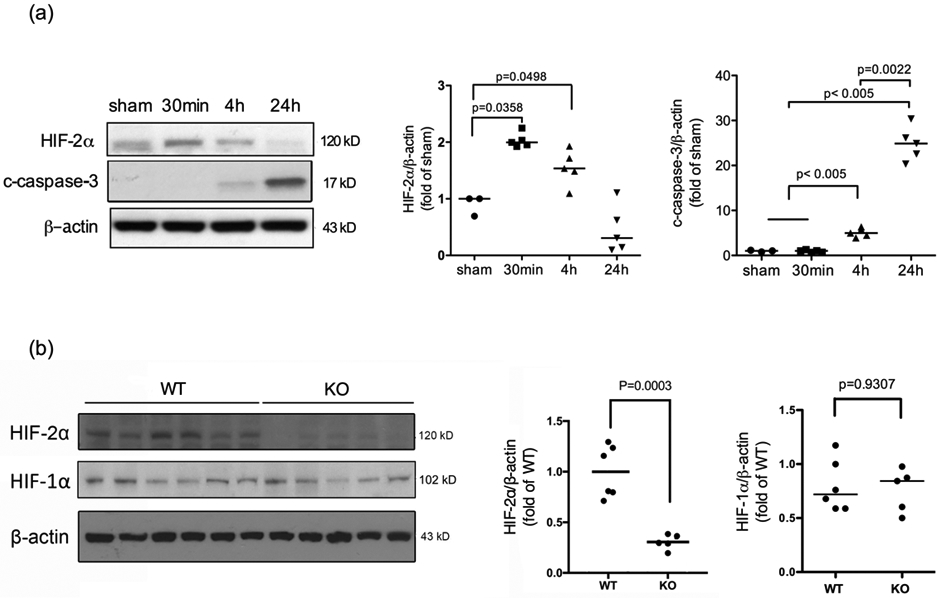
Fig. 1:

The time course of HIF-2α and cleaved caspase-3 protein expression after neonatal brain HI. (a) The nuclear fraction of cortical lysates was extracted at the indicated time points after HI and subjected to Western Blotting. The quantification of HIF-2α and cleaved caspase-3 (c-caspase-3) expression is shown on the right. The OD values were normalized to β-actin and expressed as fold change to the sham values (fold of sham). Expression of c-caspase-3 indicates brain injury at 4 h and 24 h (n=3 for sham, n=5 for HI mice). (b) Representative blots showing decreased HIF-2α expression in the KO mice compared to the WT animals at 4 h after HI. (n=6 for WT, n=5 for KO). The OD values were normalized to β-actin and expressed as fold change to the WT values (fold of WT).
