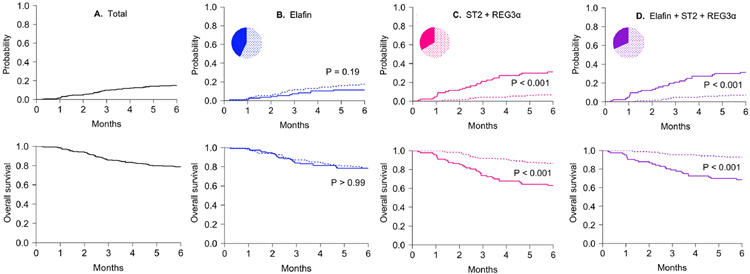
Figure 4. Cumulative incidence of nonrelapse mortality and overall survival in high and low biomarker groups.
Six-month cumulative incidences of nonrelapse mortality (NRM) in high (solid line) and low (dotted line) risk biomarker groups defined by optimized biomarker thresholds and compared using Gray’s test (upper panels). Six-month overall survival was estimated using the Kaplan-Meier method and compared by the log-rank test (lower panels). (A) Cumulative incidence of NRM (14%) and overall survival (75%) in the total validation set (N=263). (B) Cumulative incidence of NRM in the low (N=150) and high (N=113) elafin group (17% vs. 11%, P=0.19). Overall survival in the low and high elafin group (68% vs. 68%, P > 0.99). Threshold = 3.8 × 10⁻³ (C) Cumulative incidence of NRM in the low (N=175) and high (N=88) ST2 + REG3α group (6.7 vs. 31%, P < 0.001). Overall survival in the low and high ST2 + REG3α group (77% vs. 51%, P < 0.001). Threshold = 0.16 (D) Cumulative incidence of NRM in the low (N=180) and high (N=83) elafin + ST2 + REG3α group (7.0 vs. 30%, P < 0.001). Overall survival in the low and high elafin + ST2 + REG3α group (79% vs. 64%, P < 0.001). Threshold = 3.3 × 10⁻³

