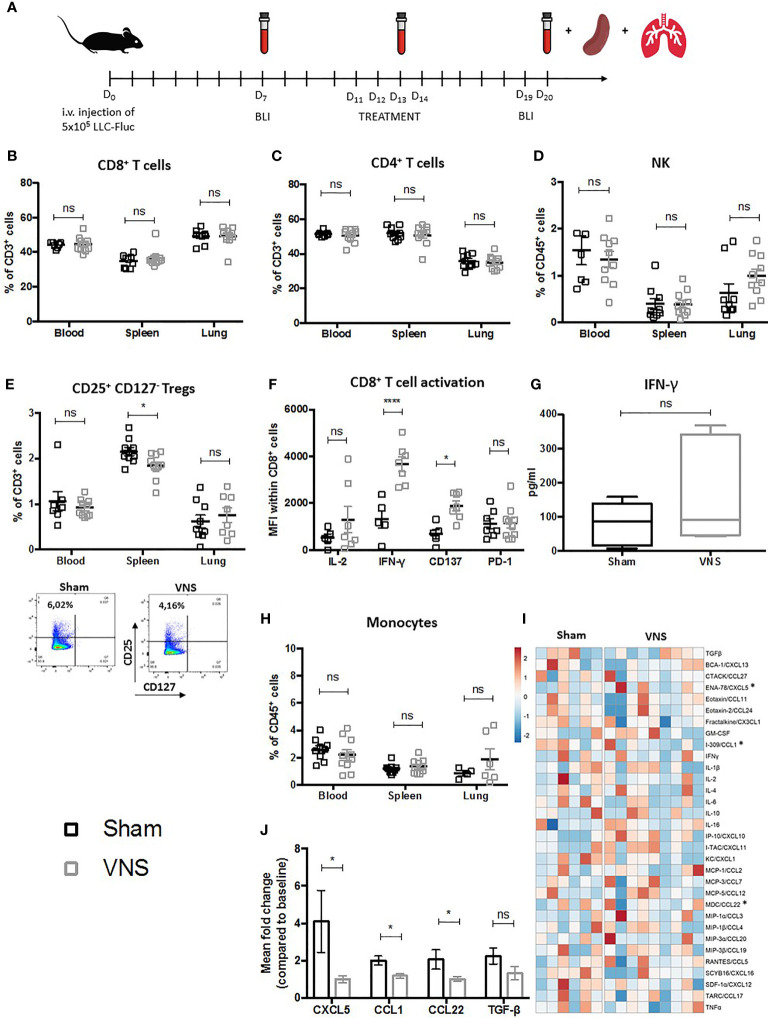
Figure 1.
Schematic representation of preclinical experimental setup and evaluation of immune cell populations in lung tumor bearing mice treated with VNS. (A) C57BL/6 mice were i.v. injected with 5x10⁵ Fluc expressing LLC tumor cells. Seven days later in vivo BLI was performed to randomize mice with similar photon counts to the VNS treated, RT treated, RT+VNS treated or sham treated control group. Mice were daily treated with VNS (25Hz) and/or RT (3,2 Gy) for four consecutive days starting at day eleven after tumor injection. Blood samples were collected at day 7 (baseline), day 13 and day 20. On day 20 after tumor injection, mice were euthanized to collect perfused lungs and spleens. (B–E, H) Flow cytometric analysis of (B) CD8+ T cells, (C) CD4+ T cells, (D) CD56+ NK cells, (E) CD4+CD25+CD127- Tregs with on the right a representative dot plot from splenic CD4+CD25+CD127- Tregs from a sham or VNS treated animal and (H) CD11b+Ly6C+ monocytes in blood, spleen and lung TME. (F, G) Cell suspensions derived from murine lung tissue were co-cultured with LLC cells at a 10:1 ratio for 24 hours. Next, expression of IL-2, IFN-γ, CD137 (4-1BB) and PD-1 was assessed on the CD8+ T cells specifically using flow cytometry (F) and IFN-γ secretion was evaluated via a mouse IFN-γ ELISA kit (G). (I, J) Data obtained from a 31-plex cytokine array on plasma samples obtained from VNS or sham treated mice. (I) Heatmap of the 31 different cytokines, in which the meanfold change of each cytokine concentration compared to baseline is visually represented with red, white, and blue to indicate high, median, and low, respectively. (J) Box plots show the significant fold changes of ENA-78 (CXCL5), I-309 (CCL1), MDC (CCL22) next to the non-significant decrease of TGF-β in the same plasma samples. Data represent three pooled experiments six days after the last treatment. Data are shown as mean ± SD of n>9 (VNS) and n>6 (sham). *P < 0,0332; ****0,0001 by two-tailed unpaired t-tests. ns, non significant.

