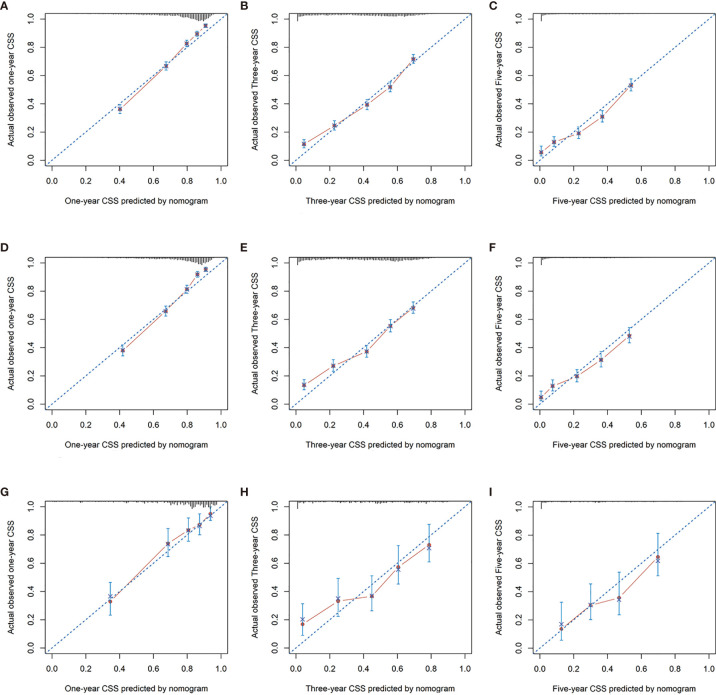
Figure 7.
Calibration curves for 1-, 3-, and 5-year CSS rate of nomogram predictions. (A–C) Represents the calibration curve for predicting the CSS of patients at 1, 3, and 5 years in the training cohorts; (D–F) represents the calibration curve for predicting the CSS of patients at 1, 3, and 5 yeara in the internal validation cohorts; (G–I) Represents the calibration curve for predicting the CSS of patients at 1, 3, and 5 years in the external validation cohorts.

