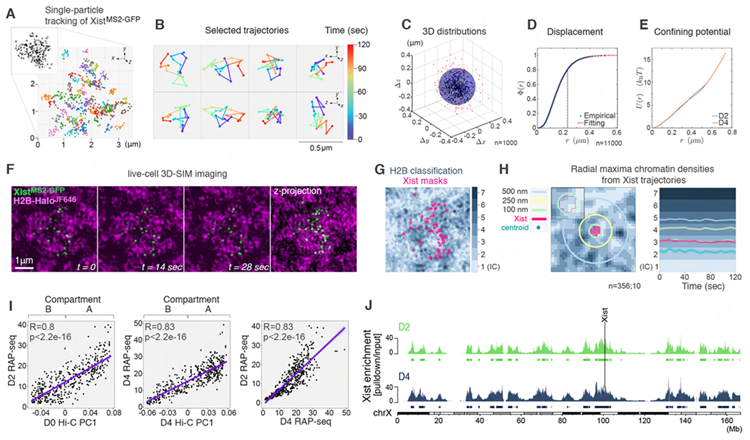
Figure 2. Xist foci are locally confined at open chromatin regions.
(A) Trajectories of XistMS2-GFP foci from live-cell 3D-SIM imaging for 2 minutes (5sec/frame) at D4. Inset: Projection of one frame showing an XistMS2-GFP cluster.
(B) Selected trajectories from A showing the displacement of Xist foci over time (color-gradient) in top (xyz, top) and side (zyx, bottom) views.
(C) D4 Xist foci displacements derived from ~100 trajectories, each centered about their centers of mass. n denotes the number of foci analyzed from four experiments.
(D) Cumulative distribution function Φ(r) of the number of displacement positions at D4 with distance from origin <r. The distance marked with the dashed line at r=0.22μm corresponds to the radius of the shaded sphere in C where ~80% of all distances lie (Methods S1 file). n denotes the number of foci analyzed from ~800 trajectories from four experiments.
(E) Effective spherically symmetric confining potential inferred from the spatial distribution of displacement distances of Xist foci at D2 and D4. We assume an equilibrium Boltzmann distribution over an effective potential energy well that is a function of r.
(F) Image sequence from t=0 to t=28sec and z-projection (from t=0) of XistMS2-GFP (green) and H2B-HaloJF646 (magenta) based on live-cell 3D-SIM.
(G) Segmentation of H2B-HaloJF646 from live-cell 3D-SIM data into seven density classes with overlay of Xist masks.
(H) Left: Schematic for the assessment of the chromatin landscape around one Xist focus. Mask (bright pink) of one Xist focus showing radial distances denoted by circles from its centroid (dark green). Inset: magnification showing the outline of the Xist mask. Right: Plot of Xist foci trajectories showing the average radial maxima of chromatin density reached at indicated timepoints. Light shaded areas show 95% confidence interval. n denotes the number of foci and cells analyzed from three experiments.
(I) Correlation of Xist enrichment determined by RAP-seq at D2 and D4 to the first principal component of ESC (D0) and D4 Hi-C data (A-compartment = positive values, B-compartment = negative values). Far right panel shows the correlation between D2 and D4 Xist RAP-seq data. Pearson correlation r-coefficients and associated p-values are given.
(J) Xist enrichment along the X chromosome, defined based on RAP-seq data for Xist over the input, at D2 and D4, with peak calls below. The Xist locus is indicated.

