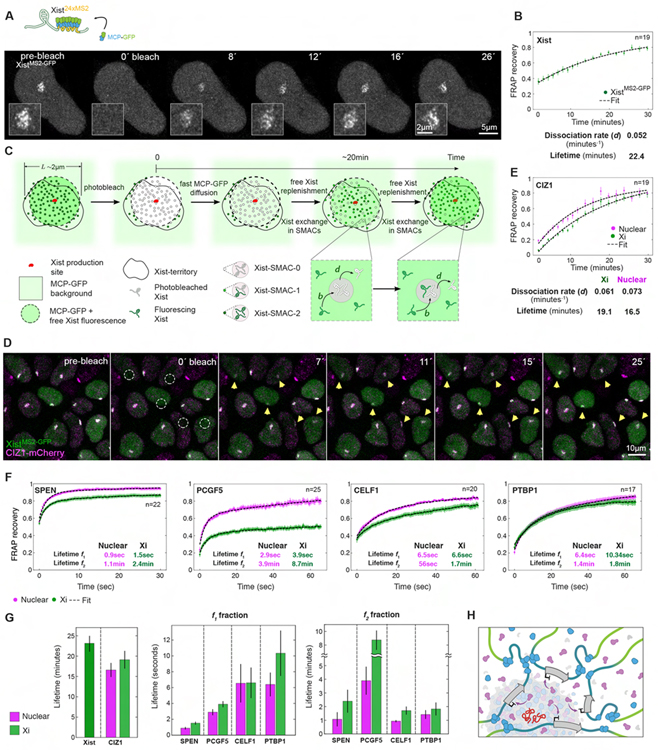
Figure 4. FRAP of Xist interactors identifies diverse protein behaviors in the Xi.
(A) Top: Schematic of Xist live-cell labeling. Bottom: Image sequence from an Airyscan FRAP experiment of XistMS2-GFP at D4. Insets show the Xist territory.
(B) XistMS2-GFP FRAP recovery at D4 and fitting. Error bars indicate the standard error. Dissociation rate and lifetime inferred from fitting are given. n denotes the number of cells analyzed from four experiments.
(C) Model for the Xist FRAP process. The expression and replenishment of Xist from its expression site is assumed to be fast and free MCP-GFP replenishment is assumed almost instantaneous after t=0. The exchange of photobleached with fluorescing Xist is assumed fast in the Xi-territory outside Xist-SMACs (free pool) and slow within XistSMACs. Xist-SMACs with zero, one, and two fluorescing Xist molecules are denoted Xist-SMAC-0, −1, and −2. Binding of Xist to sites in SMACs occurs at rate b and dissociation at rate d, which sets the timescale for FRAP recovery. The FRAP curves for Xist were fit with a single exponential.
(D) Image sequence showing a FRAP experiment of XistMS2-GFP (green) and CIZ1-mCherry (magenta) at D4. Dashed circles indicate bleached Xist-territories and yellow arrows monitor recovery.
(E) FRAP recovery and fitting (dashed black lines) of the nuclear and Xist-associated populations of CIZ1-mCherry. Error bars denote the standard error. Parameters from fitting with a single exponential are given. n denotes the number of cells analyzed from four experiments.
(F) FRAP recovery and fitting (dashed black lines) of the nuclear and Xist-associated populations of SPEN-HaloTMR, PCGF5-HaloTMR, CELF1-mCherry and PTBP1-HaloTMR at D4. Error bars denote the standard error. Every fifth timepoint is shown. Lifetimes for the slow (f1) and fast (f2) detaching fractions inferred for each protein from bi-exponential fitting are indicated. n denotes the number of cells analyzed from two experiments.
(G) Bargraphs showing the lifetimes for Xist and CIZ1 (left) and for the two subpopulations (f1, f2) of bi-exponentially fitted proteins (right). Error bars denote the standard error.
(H) Schematic showing an Xist-SMAC and its dynamic regulatory compartment. The increased accumulation of proteins surrounding Xist (red) and their rapid cycling results in gradients over broad chromosomal regions in the vicinity to the SMAC. SPEN is depicted in purple, accumulation of PCGF5 in blue, and purple arrows indicate the gene silencing function of SPEN.

