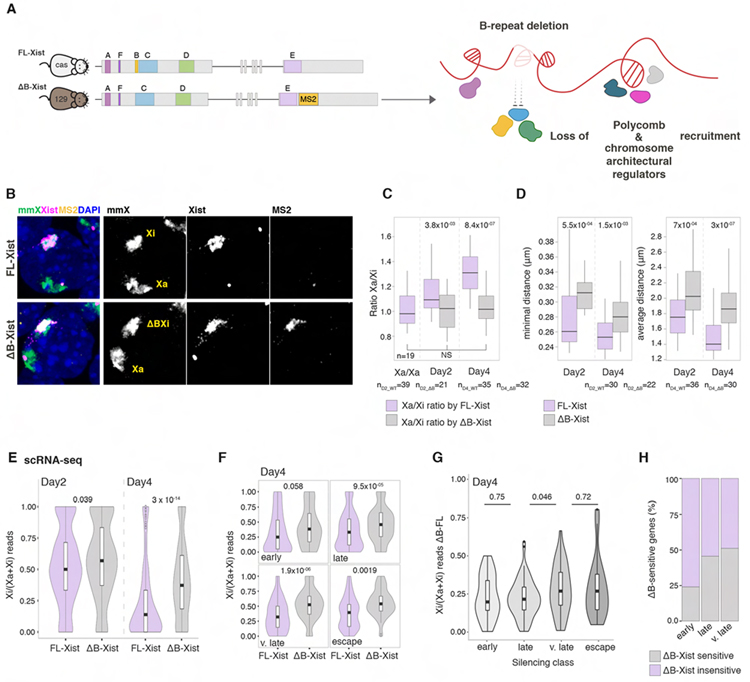
Figure 6. The B-repeat is critical for Xi compaction and late gene silencing.
(A) Schematic of the heterozygous deletion of the B-repeat of Xist and insertion of a MS2 tag on the 129 X chromosome in female mouse 129/cas ESCs (XistΔΒ+MS2/WT ESCs). The effect of the B-repeat deletion is indicated.
(B) RNA/DNA FISH of XistΔΒ+MS2/WT cells at D4 using X-chromosome paints (mmX, green), Xist (magenta) and MS2 probes (yellow). DAPI staining is shown in blue. Greyscale images show individual channels as indicated.
(C) Boxplots showing the ratio of Xa/Xa at D2 in cells not expressing Xist and of Xa/Xi in FL-Xist (purple) or ΔB-Xist (grey) expressing XistΔΒ+MS2/WT cells at D2 and D4. n is the number of cells analyzed from two replicates.
(D) Boxplots showing the minimal (left) and average (right) distance between Xist foci in FL- or ΔB-Xist expressing cells at D2 and D4. n is the number of cells analyzed from three experiments.
(E) Violin plots of Xi ratios of X-linked gene expression at D2 and D4 in XistΔΒ+MS2/WT cells or parent WT (XistWT-MS2/WT) cells silencing the WT- or ΔB-Xist 129 X chromosome. Mean Xi ratio per gene was averaged across single cells based on scRNA-seq data. MWW p-values are given.
(F) As in E, except that genes are grouped by gene silencing dynamics. MWW p-values are given.
(G) Violin plots of the difference in Xi ratio between the ΔB- and WT-Xist expressing Xi shown in F. MWW p-values are given.
(H) Bargraphs showing the proportion of ΔB-sensitive or insensitive genes from F. Genes were considered ΔB-sensitive based on a one-sided Welch t-test comparing ΔB and WT Xi129 ratios, p-value<0.05.

