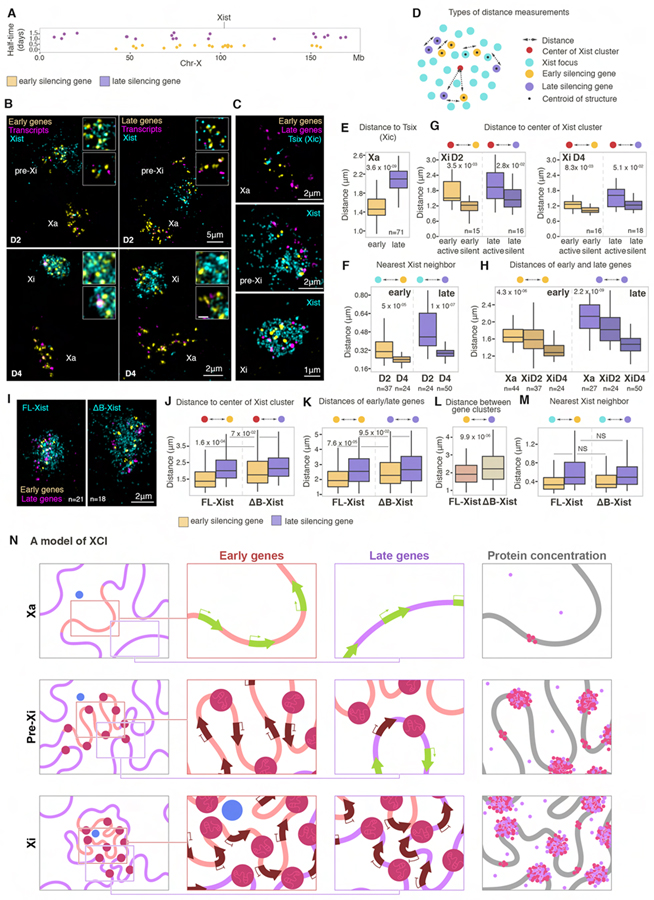
Figure 7. Xist-SMACs progressively re-configure and silence the Xi.
(A) Annotation of the position of early (yellow) and late (purple) genes on the X chromosome simultaneously detected with oligo probes in RNA/DNA FISH experiments and their silencing half-time.
(B) 3D-SIM projections of nuclei after RNA/DNA FISH, showing indicated gene sets (yellow), their corresponding transcripts (magenta), and Xist signals (cyan) at D2 and D4. Xa, pre-Xi and Xi are indicated. Insets show magnifications of pre-Xi or Xi areas with high (top) and low (bottom) Xist density. Images are smoothed with a 3×3 px for clarity.
(C) 3D-SIM projections of Xa, pre-Xi or Xi regions after RNA/DNA FISH for Xist (cyan), early (yellow) and late (magenta) genes at D2 and D4.
(D) Schematic of different types of distance metrics performed in this figure.
(E) Boxplots of distances of early (yellow) or late (purple) genes relative to Tsix signals on the Xa. n denotes the number of cells analyzed from three experiments. MWW p-value is given.
(F) Boxplots of the nearest distance of Xist foci to early (yellow) or late (purple) genes at D2 and D4. n denotes the number of cells analyzed from three experiments. MWW p-values are given.
(G) Boxplots of distances of early (yellow) or late (purple) genes to the center of the Xist cluster at D2 and D4, divided into silent or active based on nascent transcripts detection. n is the number of cells analyzed from three experiments. MWW p-values are given.
(H) Intra-genic distances of early (yellow) or late (purple) genes on the Xa, pre-Xi, or Xi at D2 and D4. n denotes the number of cells analyzed from three experiments. Kruskal-Wallis p-values are given.
(I) 3D-SIM projections of the Xi after RNA/DNA FISH for Xist (cyan), early (yellow) and late (magenta) genes in male FL- or ΔΒ-Xist expressing ESCs after 18hrs doxycycline induction of tetO-Xist. n denotes the number of cells analyzed in J to M from two experiments. MWW p-values are given.
(J) Boxplots of distances of early (yellow) or late (purple) genes to the center of the Xist cluster in FL- or ΔΒ-Xist expressing cells described in I.
(K) As in J, except for intra-genic distances of early (yellow) or late (purple) genes.
(L) As in J, except for the distances of early to late silencing genes.
(M) As in J, except for nearest neighbor distance of early (yellow) or late (purple) genes to Xist foci.
(N) SMAC-based model of XCI. Left column shows the changes in the higher-order chromatin organization between the Xa (top), pre-Xi (middle) and Xi (bottom). The Xist production site is shown in blue, SMACs in dark red, and genomic regions harboring early and late silencing genes with orange and purple lines, respectively. Insets indicate regions of early (top) or late (bottom) silencing genes magnified in the second and third columns to show the progression of silencing. Arrows indicate active (green) and silent (brown) genes. Fourth column shows the increase in protein concentration upon establishment of Xist-SMACs. Pink dots indicate Polycomb-group proteins and purple dots SPEN. Free protein dots indicate increased concentrations in the Xi due to the presence of SMACs. Architectural protein-mediated chromosomal compaction is depicted by pink islets on the DNA fiber.

