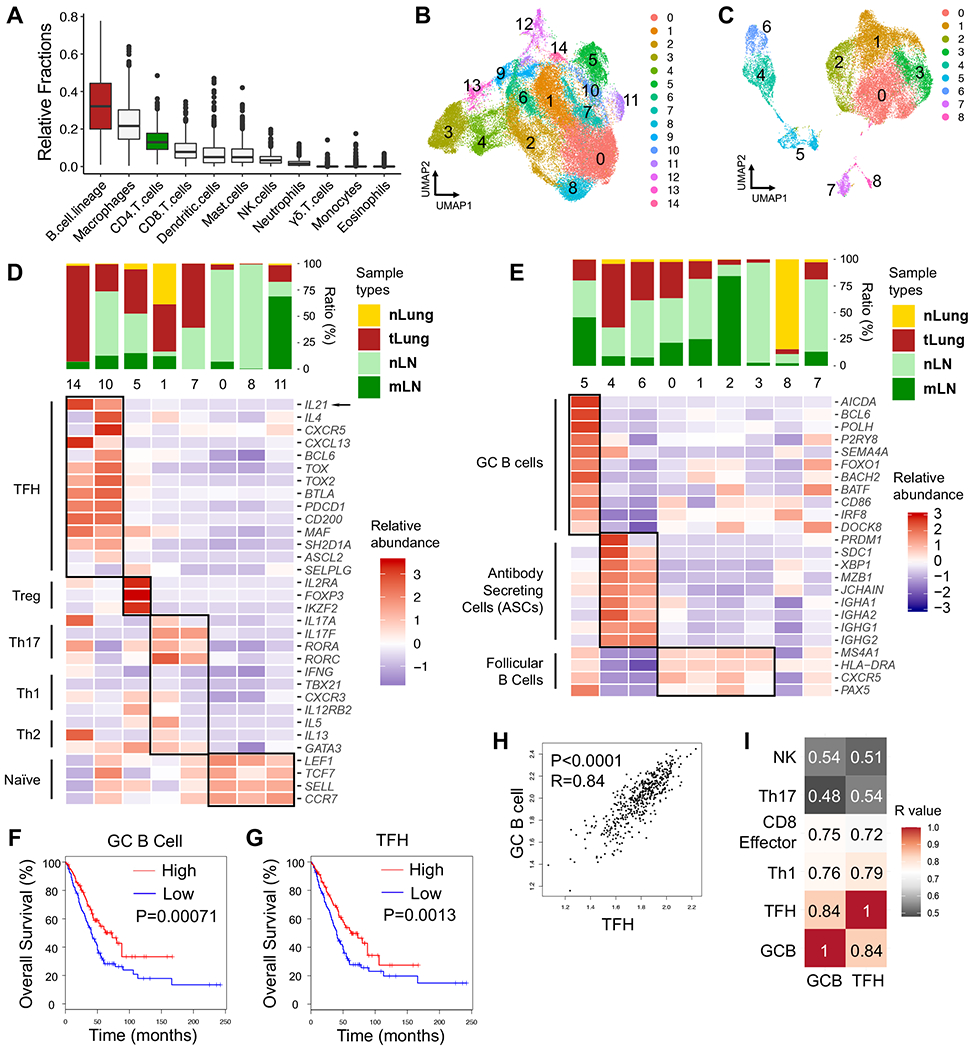
Figure 1. GC B cells and TFH cells correlate with favorable clinical outcomes in LUAD patients.

A, Estimated fractions of immune cell subsets from bulk expression data of primary tumor tissues in TCGA-LUAD patient cohort (n=513). CIBERSORT algorithm was used for deconvolution.
B – E, scRNA-seq analyses (GSE131907, Kim et.al.) of T/NK and B cell clusters in treatment-naïve human LUAD samples from primary sites (tLung), metastatic LNs (mLN), normal lung tissues (nLung) and normal LNs (nLN). B – C, UMAP displaying T/NK (B) and B cell clusters (C). D – E, Bar graphs displaying tissue origins (top) and heatmaps (bottom) showing relative abundance of signature genes in CD4 T cell (D) and B cell clusters (E).
F – G, Survival analyses based on GC B cell-signature (F) and TFH-signature (G) in TCGA-LUAD patient cohort (n=478).
H, Correlation analyses on GC B cell-signature and TFH-signature in TCGA-LUAD cohort.
I, Heatmap showing R values for the correlations among expression signatures of GC B cells, TFH, Th1, CD8 effector cells, Th17, NK cells in TCGA-LUAD cohort.
F – G, log-rank Mantel-Cox test. H – I, two-tailed Pearson correlation test.
