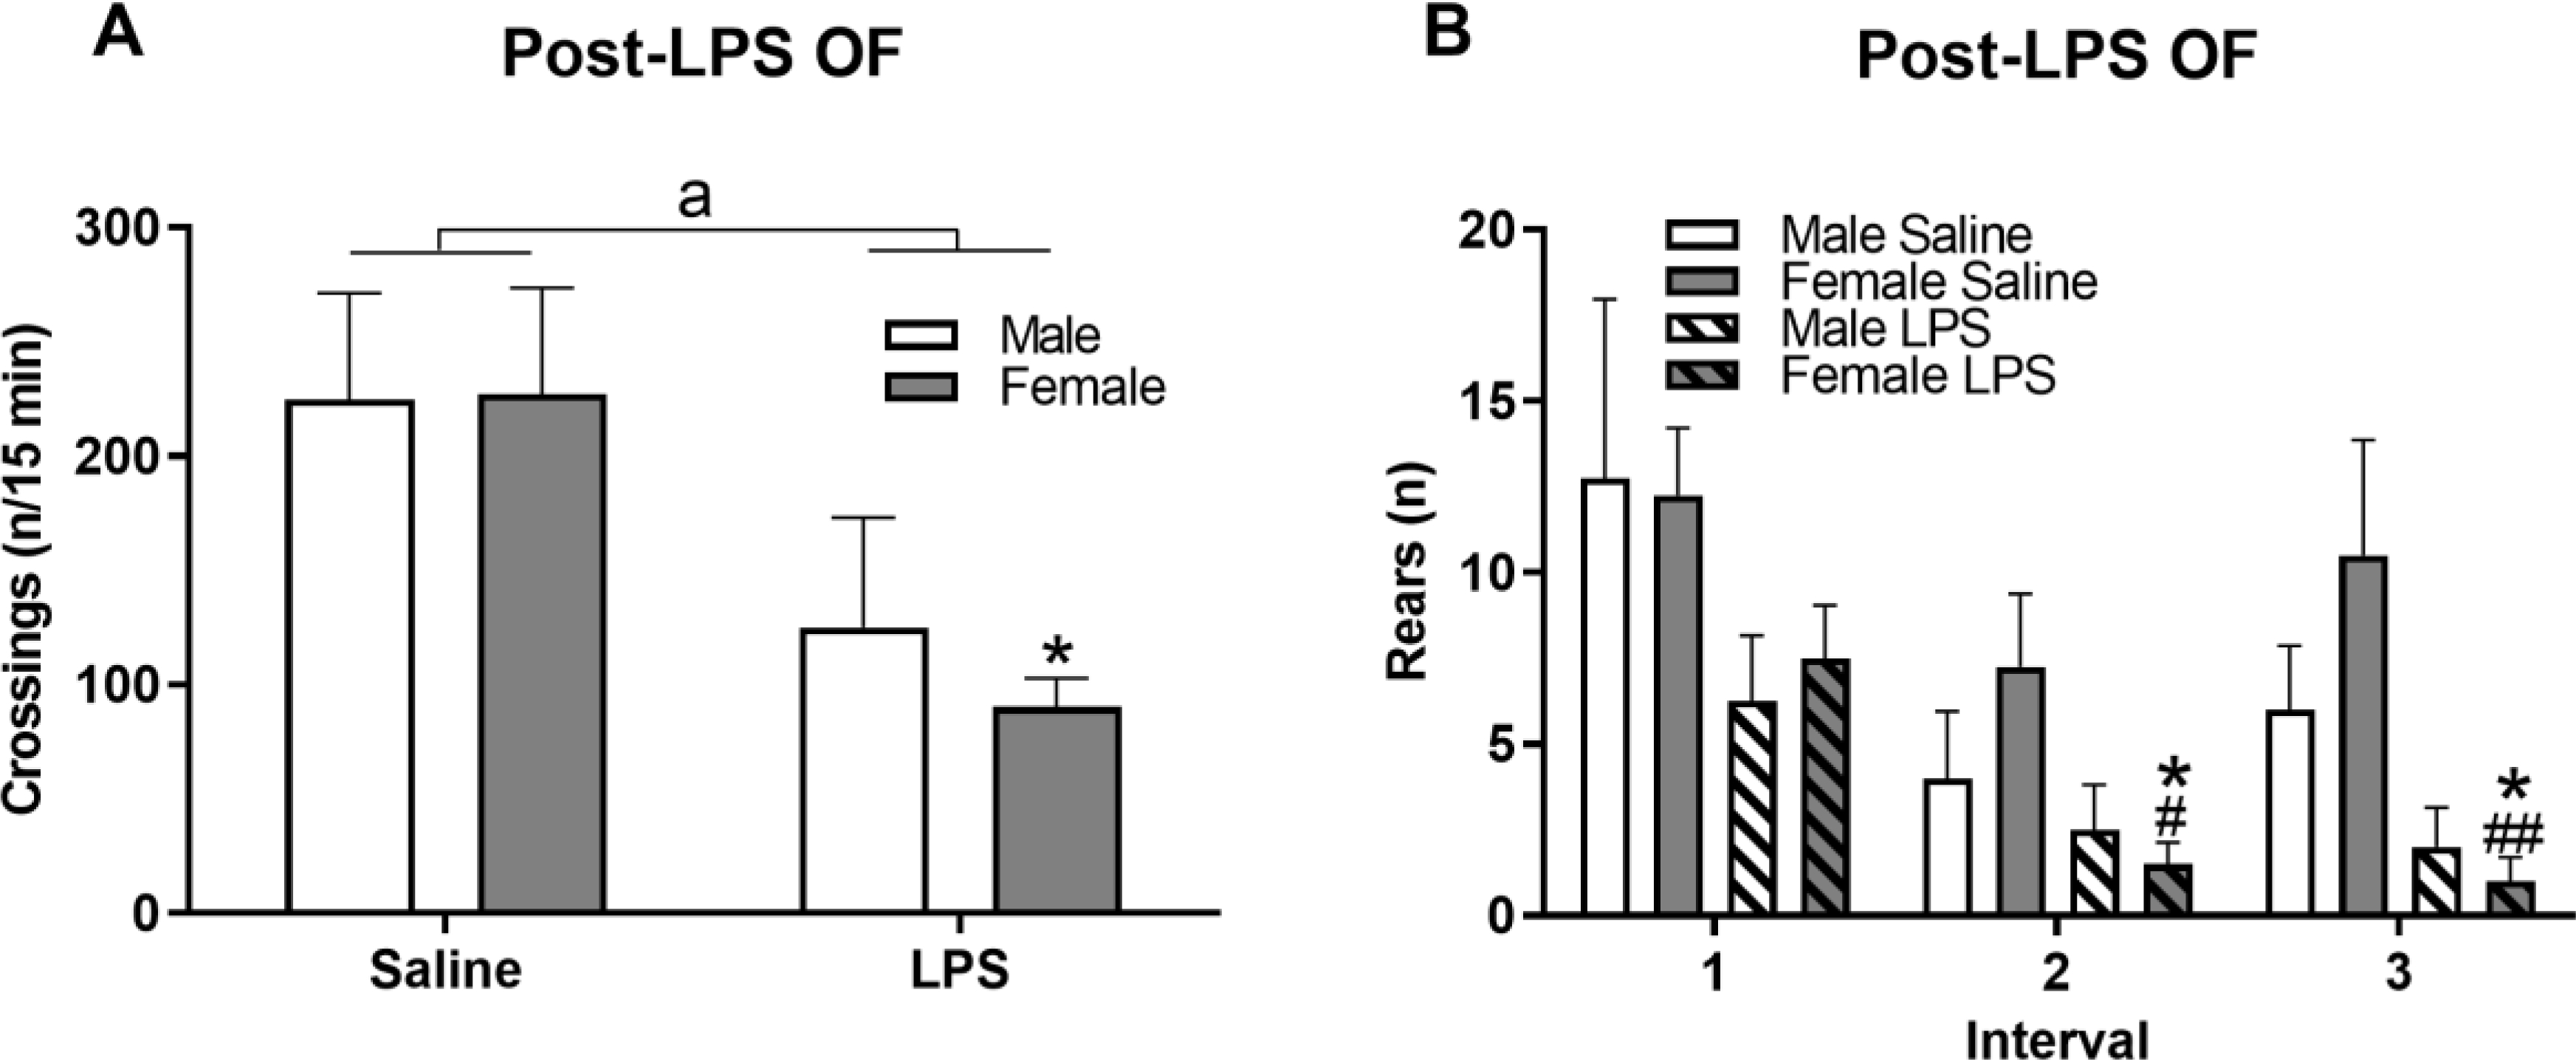
Figure 5. Females exhibited greater sickness behavior in the OF test post-LPS.

Four h following LPS administration, sickness behavior was assessed via the OF by measuring number of zone crossings made (A) and rearings in each of the 5-min intervals (B). Data are presented as mean ± SEM; n = 4/sex/treatment. a indicates main effect of LPS treatment p ≤ 0.05; * indicates p ≤ 0.05 LPS effect within sex; # and ## indicate p ≤ 0.05 and 0.01, respectively, between interval 1 and indicated interval.
