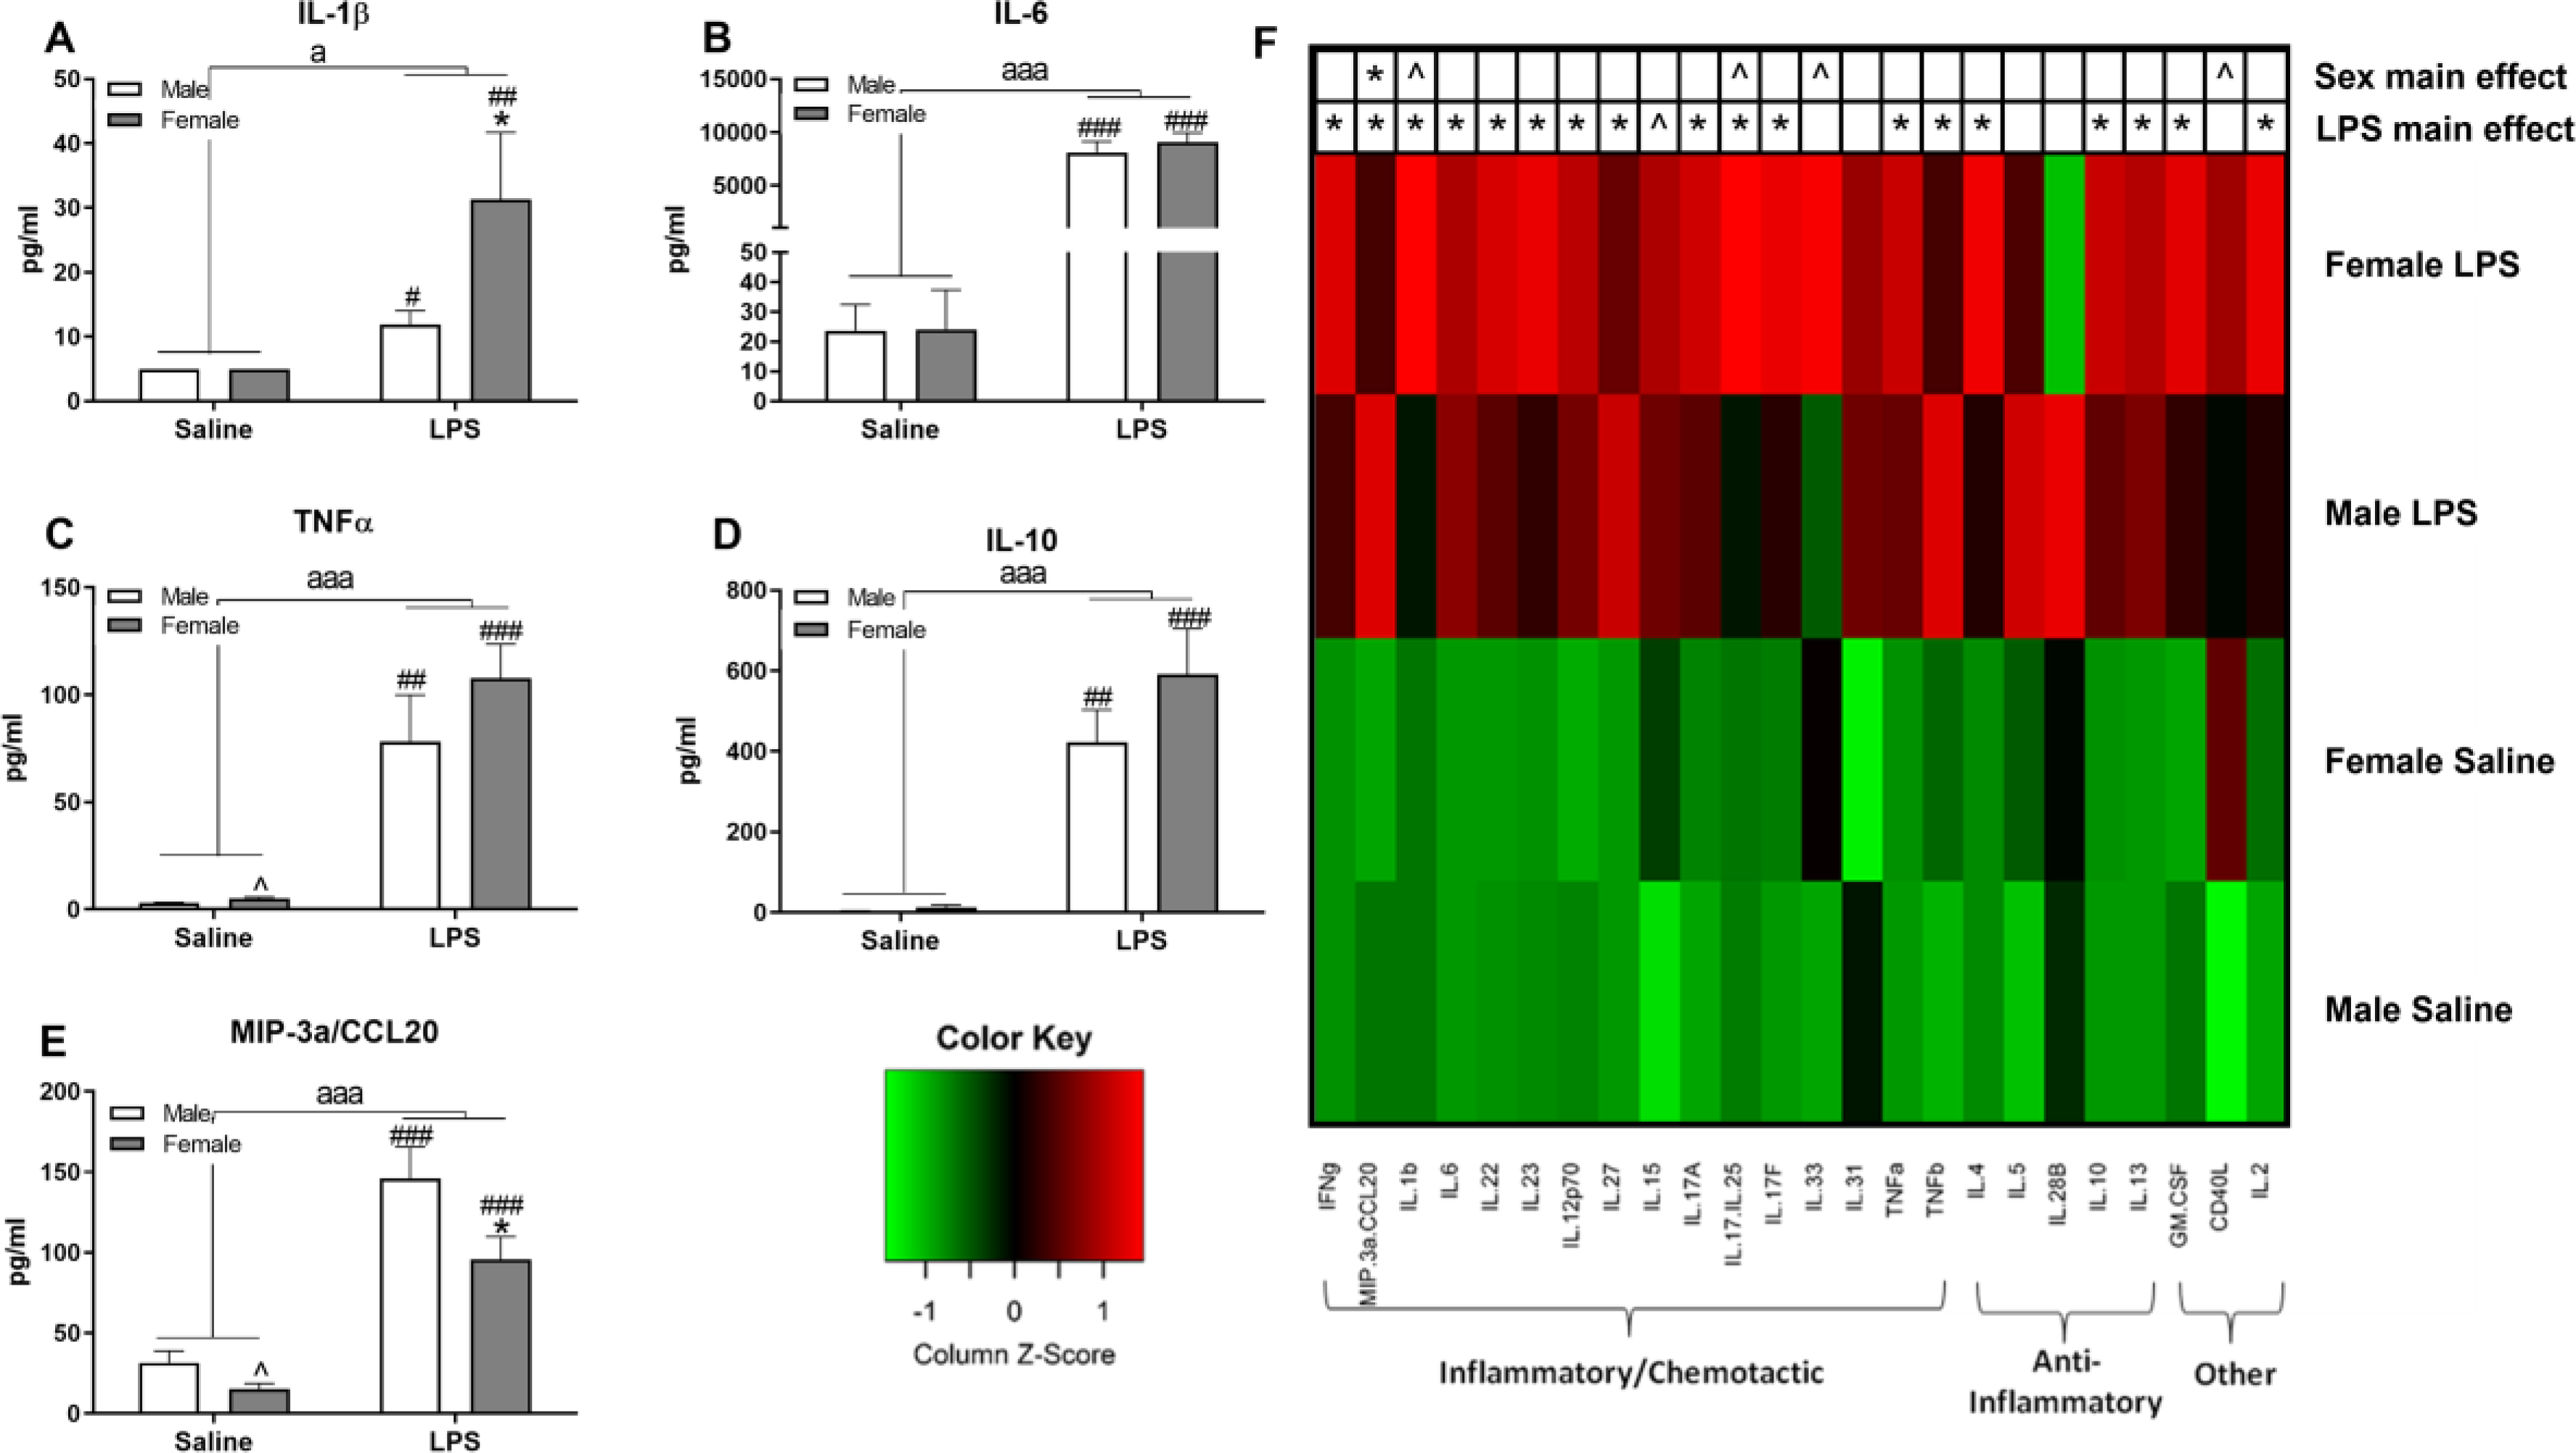
Figure 6. Females exhibited greater plasma cytokine response following LPS administration.

Selected plasma cytokines measured 6 h post-LPS include IL-1β (A), IL-6 (B), TNFα (C), IL-10 (D), and MIP-3α (E). Data are presented as mean ± SEM; LPS: n = 5/sex, Vehicle: n = 4/male, 5/female; a and aaa indicate p ≤ 0.05 and 0.001, respectively, for a main effect of LPS treatment; ^ indicates trend for sex differences within treatment, p ≤ 0.10; * indicates sex differences within LPS treatment, p ≤ 0.05; ## and ### indicate p ≤ 0.01 and 0.001, respectively, within sex. A heatmap was generated to display 24 different measured cytokines (F). Green and red transitions indicate, respectively, decreases and increases from the average cytokine concentration. ^ and * indicate p ≤ 0.10 and 0.05, respectively, for LPS or sex effects as designated on the heatmap.
