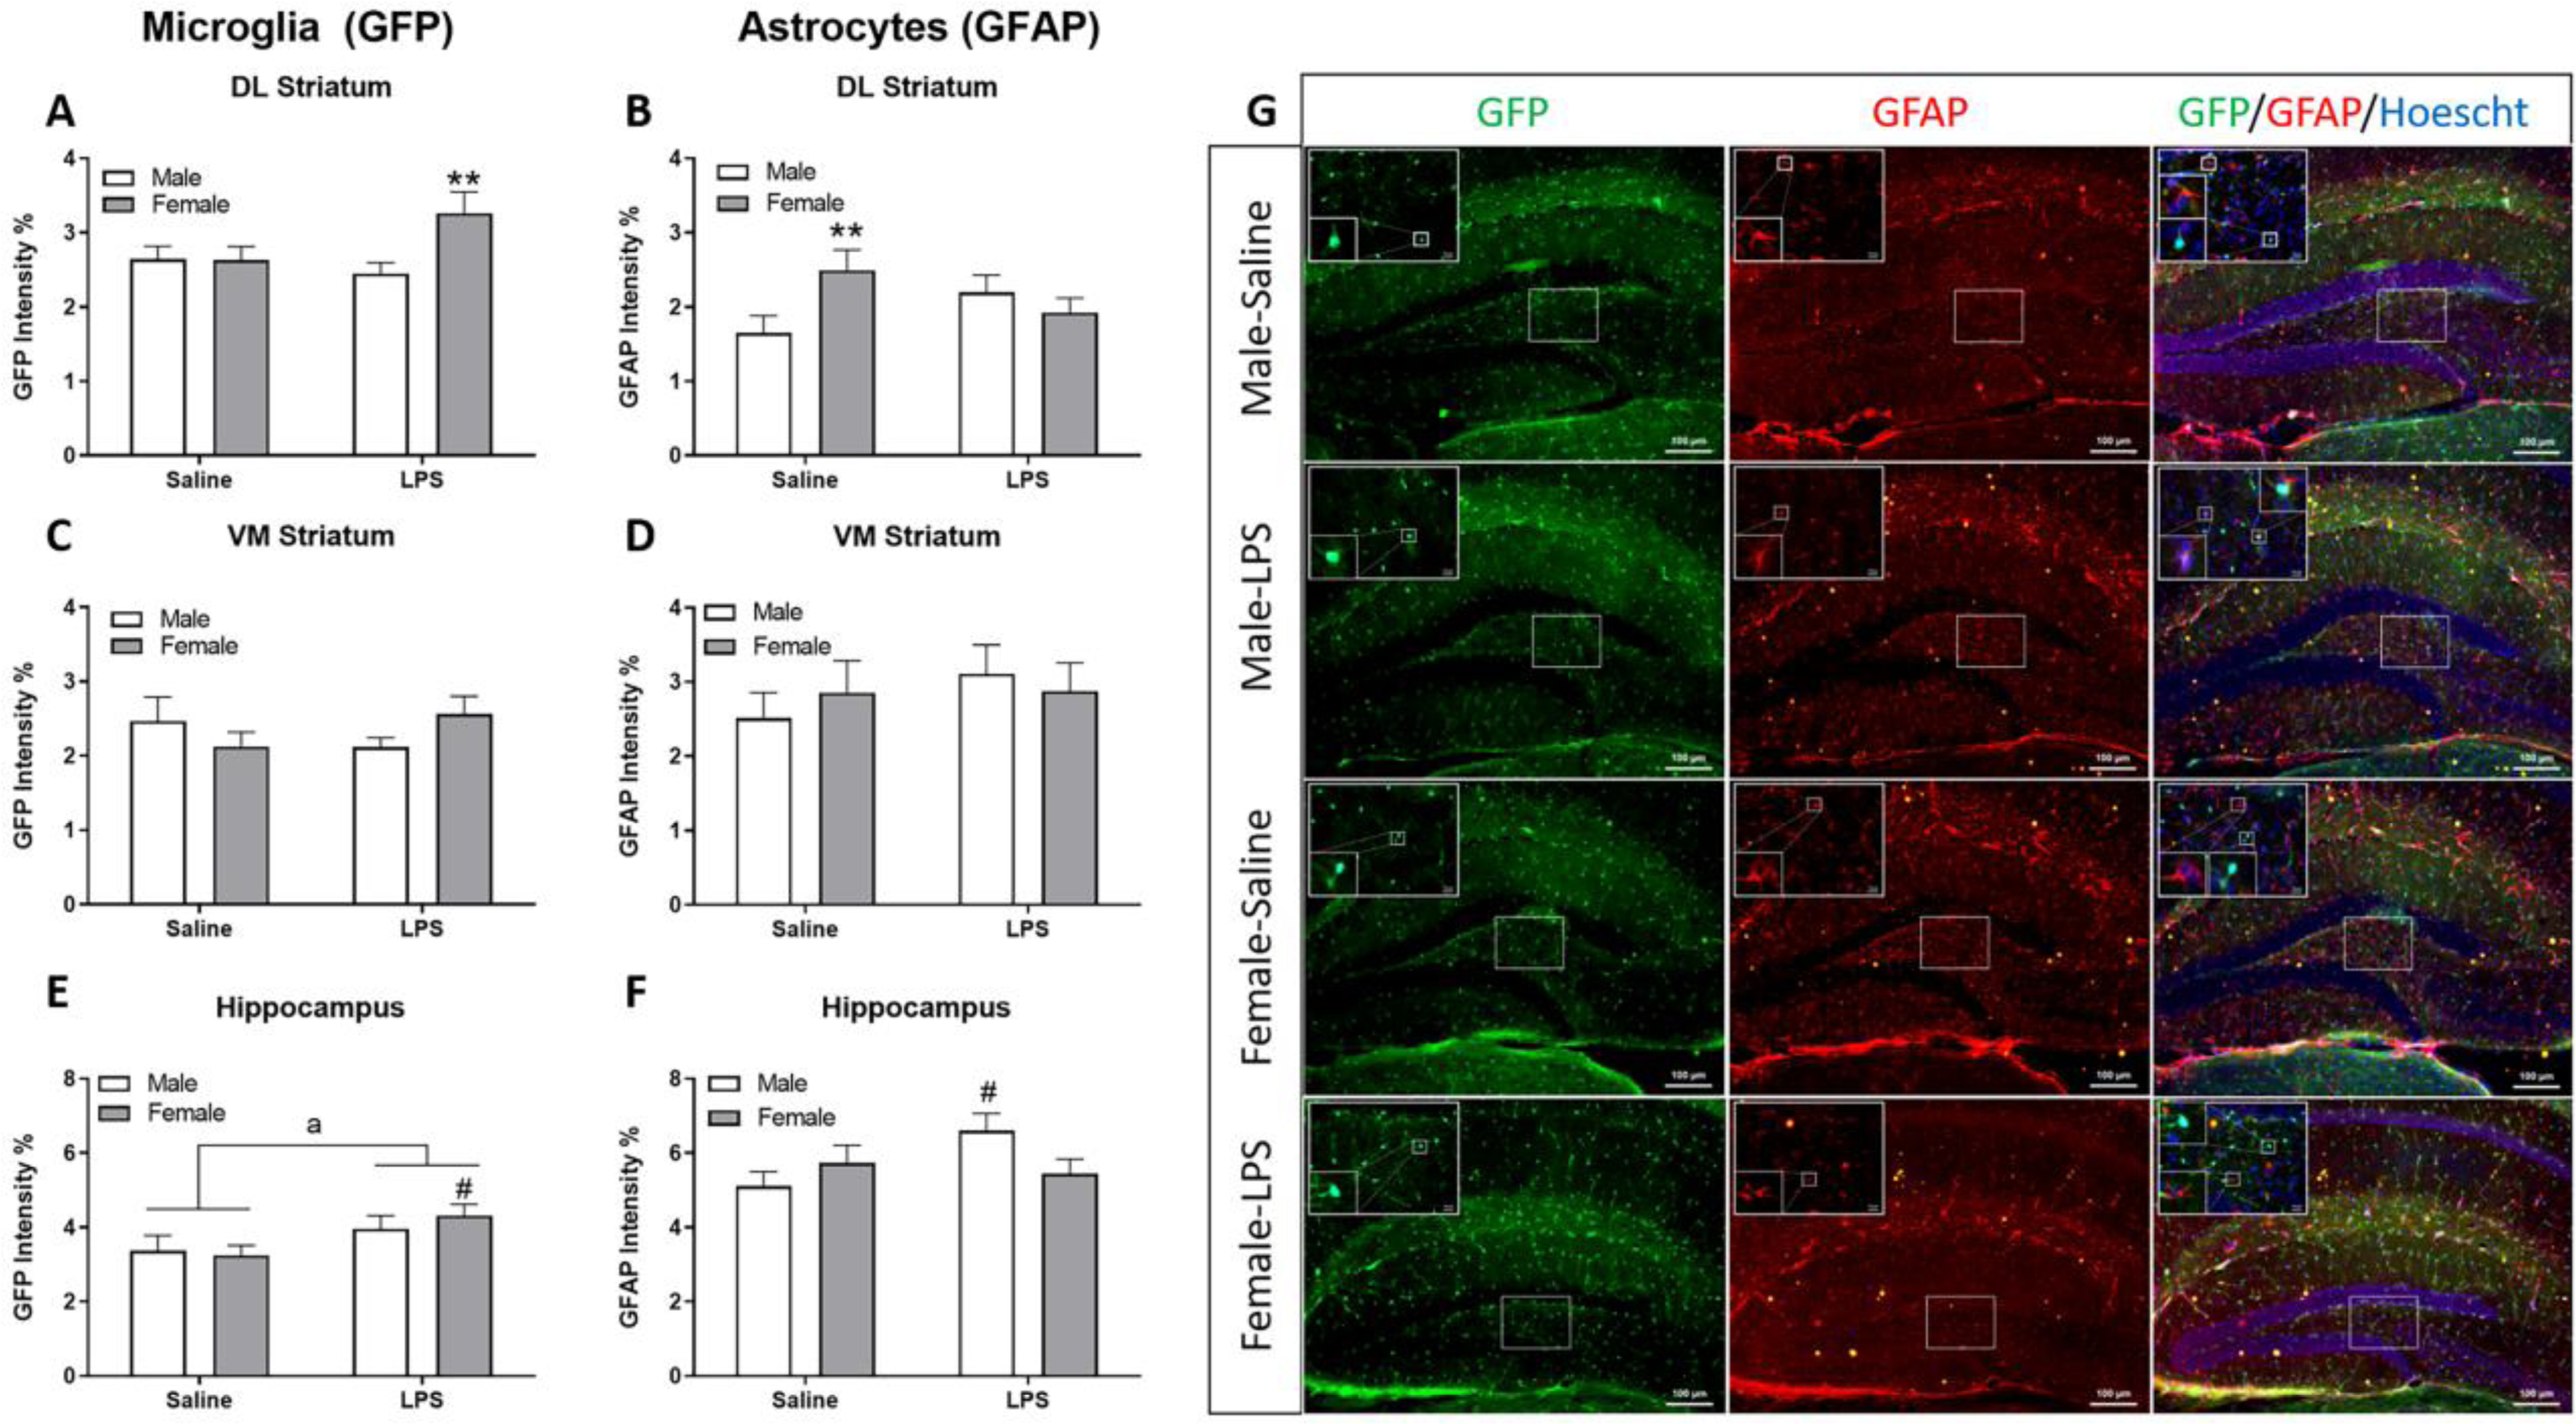
Figure 8. Increases in glial activation 6 h post LPS were brain region specific and more robust in females.

Calculated integrated optical density (as % of total area) for dorsolateral (DL) striatum for GFP (microglia) (A) and GFAP (astrocytes) (B). Similar analysis is represented in the ventromedial (VM) striatum and hilus of the hippocampus for GFP (C, E) and GFAP (D, F), respectively. Representative images of the hippocampus were captured at 10x with insets at 63x for GFP (green), GFAP (red), and nuclear (Hoechst) staining (blue) (G). Data are presented as mean ± SEM of the integrated density of fluorescent intensity of GFP or GFAP; n = 23–24 slices/group. a indicates p ≤ 0.05 for main treatment effect; ** indicates sex difference (p ≤ 0.01) within treatment; # indicates treatment effect (p ≤ 0.05) within sex.
