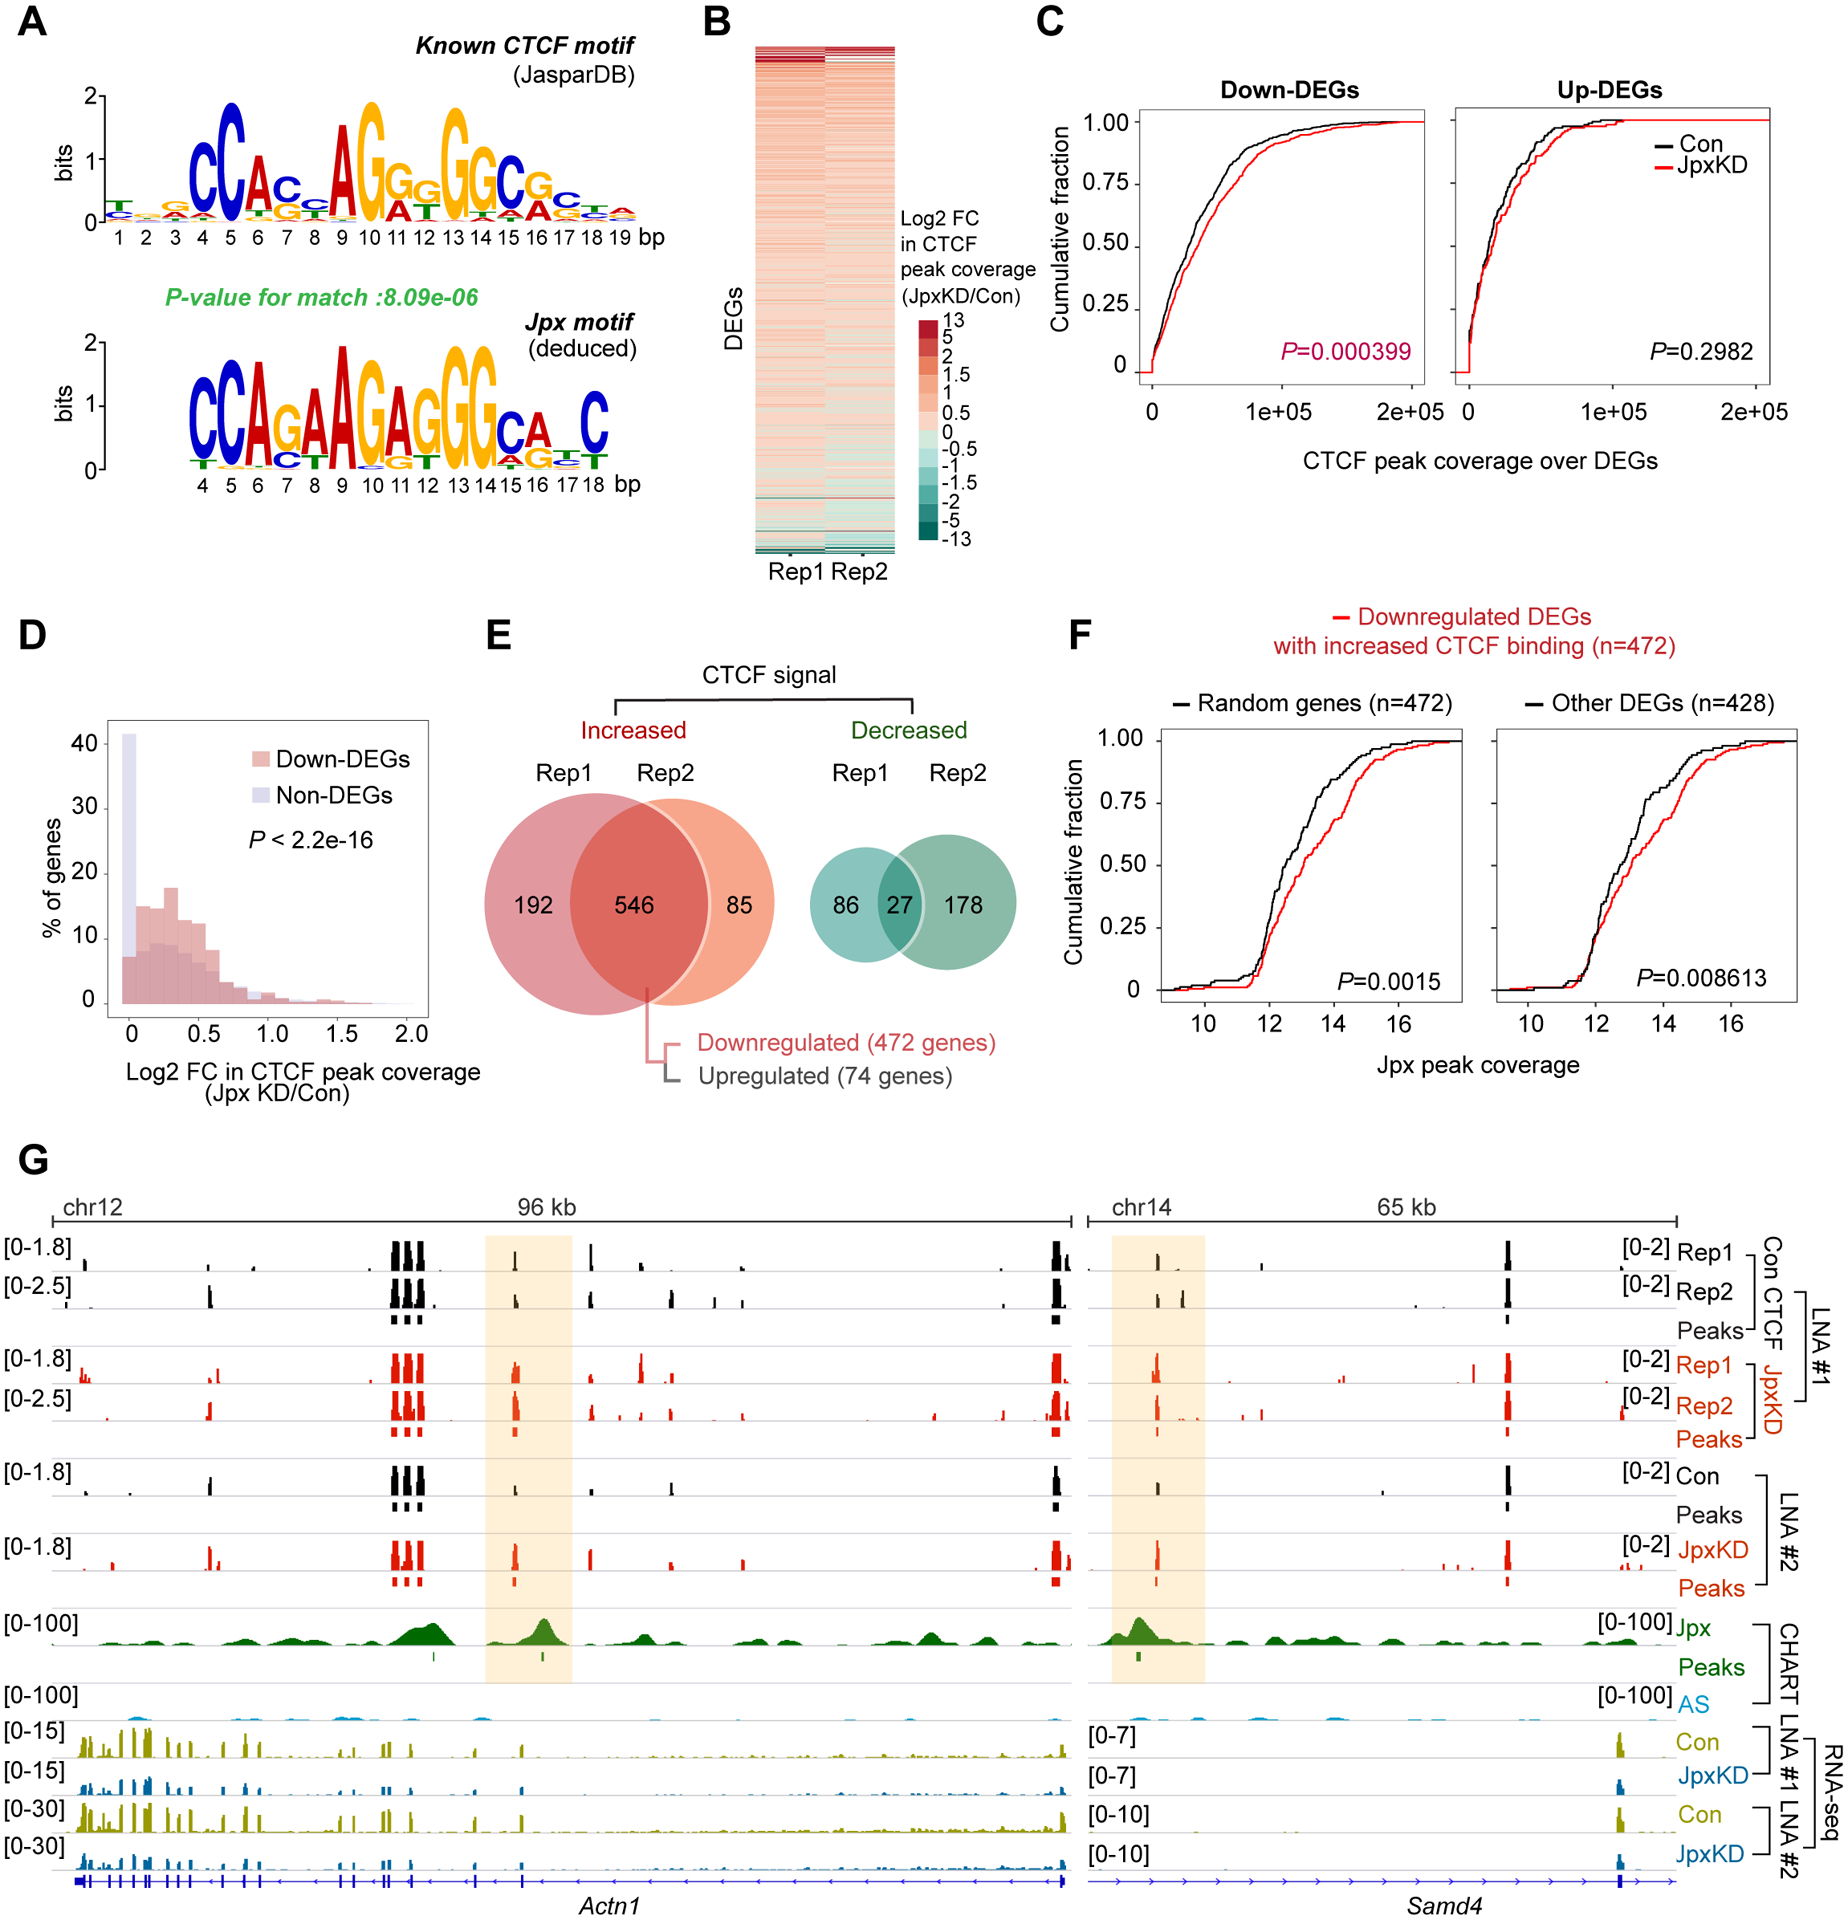
Figure 3. Jpx loss causes a massive global displacement of CTCF.

(A) Logograms reveal sequence similarities between CTCF motif (JASPAR database) and Jpx motif.
(B) Heatmap depicting log2 FC in CTCF peak coverage for DEGs between control and Jpx-depleted d7 ES cells in two biological replicates.
(C) Cumulative distribution plots (CDP) comparing CTCF peak coverage between control and Jpx-depleted cells for downregulated (left) or upregulated (right) DEGs. P determined by Kolmogorov-Smirnov (KS) test.
(D) Histogram showing the percentage of down-DEGs vs. non-DEGs with the indicated log2 FC in CTCF peak coverage. P-value, KS test.
(E) Venn diagrams showing the overlap of DEGs with increased or decreased CTCF peak coverage across two biological replicate experiments. DEGs exhibiting the reproducible increase in CTCF peak coverage were further categorized into downregulated (n=472) or upregulated (n=74) genes.
(F) CDP of log2 Jpx peak coverage for downregulated 472 DEGs with increased CTCF binding compared to 472 genes randomly selected from non-DEGs (left) or remaining 428 DEGs (right). Randomizing gene subset was generated by random selection from non-DEG (n=22,824). P-values, KS test.
(G) Genome browser views of d7 Jpx CHART-seq, CTCF ChIP-seq and RNA-seq data for the indicated down-DEGs. See also Fig. S5C. CTCF coverage, log2 fold-enrichment estimates relative to input. Significant CTCF and Jpx peaks shown as bars. Two biological replicates and two distinct Jpx LNAs shown.
