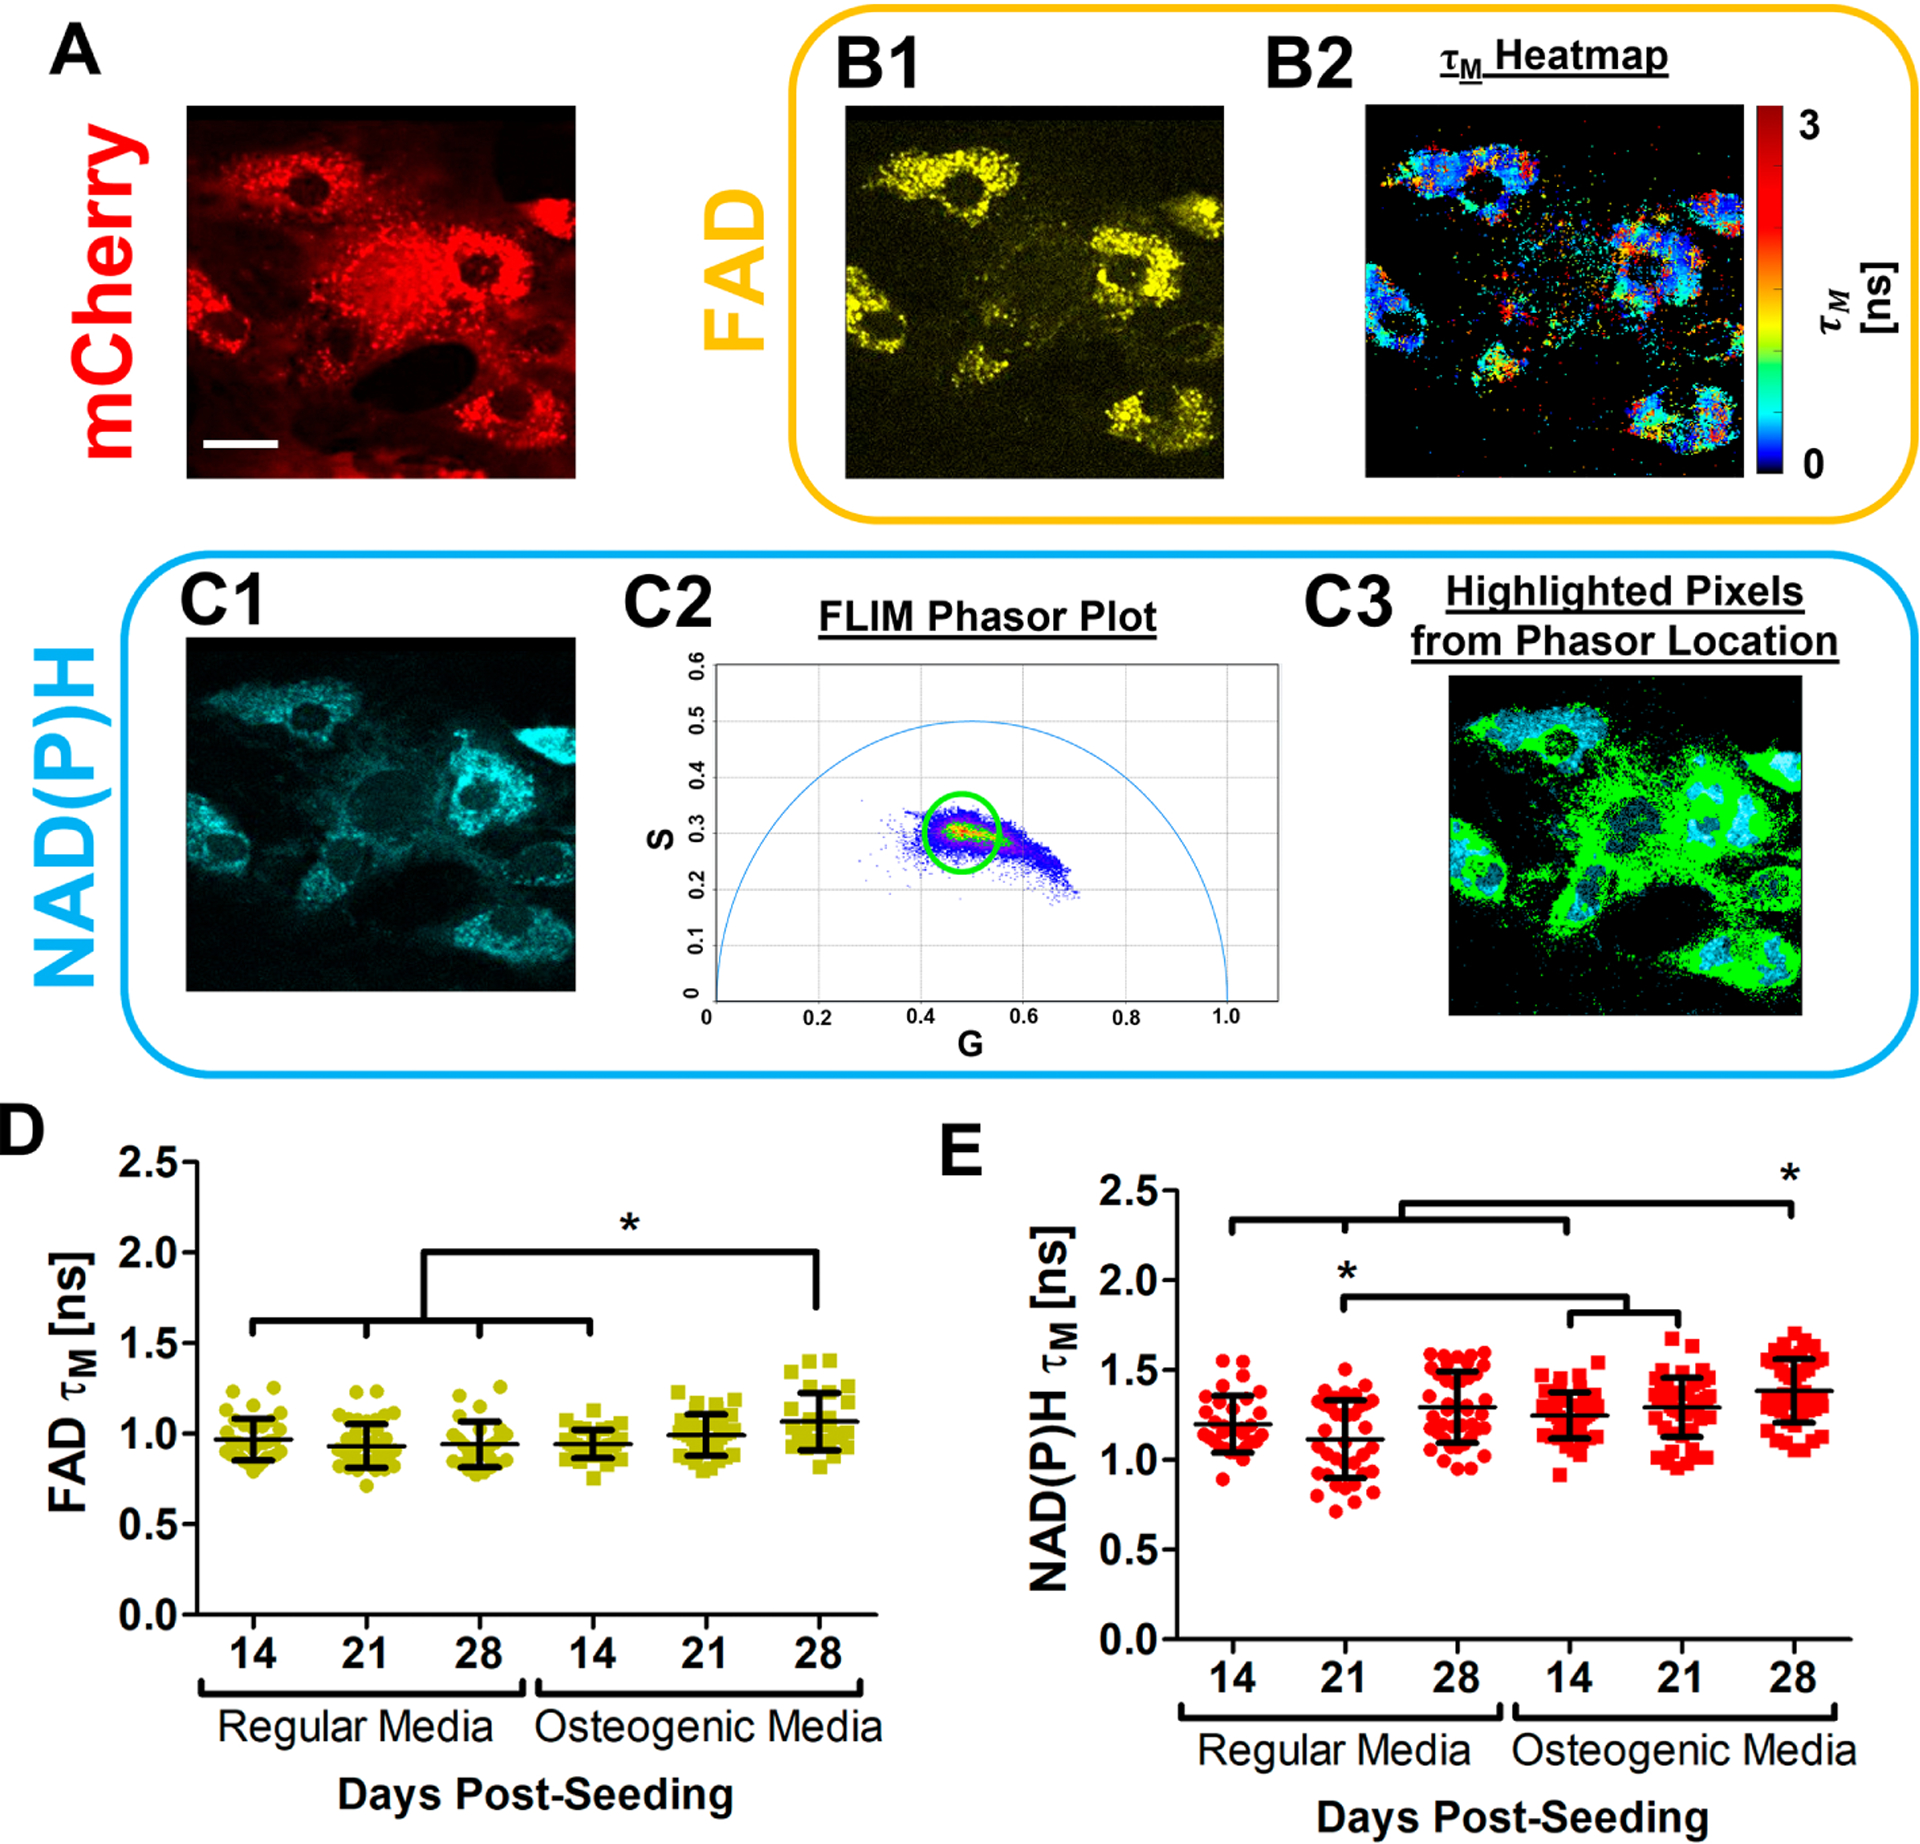
Fig. 3. In vitro NAD(P)H and FAD fluorescence lifetime analyses of OSX-mCherry BMSCs in regular or osteogenic media.

Representative fluorescence intensity images of OSX-mCherry+ osteoblasts (red) (A) at day 21 post-seeding in regular media. FAD 2P-FLIM was conducted on the mCherry+ osteoblasts. Representative FAD intensity image (B1, yellow) was collected and a corresponding τM intensity distribution heatmap image (B2) was calculated. NAD(P)H 2P-FLIM (C1) was also performed where the NAD(P)H lifetime was converted into the phasor plot (C2), through which the circled lifetime species (green) were assigned to the corresponding regions within the cells (C3). The mean FAD τM (D) and NAD(P)H τM (E) calculated for OSX-cherry+ osteoblasts in regular or osteogenic media at days 14, 21, and 28 post-seeding are shown, respectively. [scale bar = 5 μm]. [N≈17 cells in each of 3 parallel experiments per group, *, p<0.05, One-Way ANOVA]
