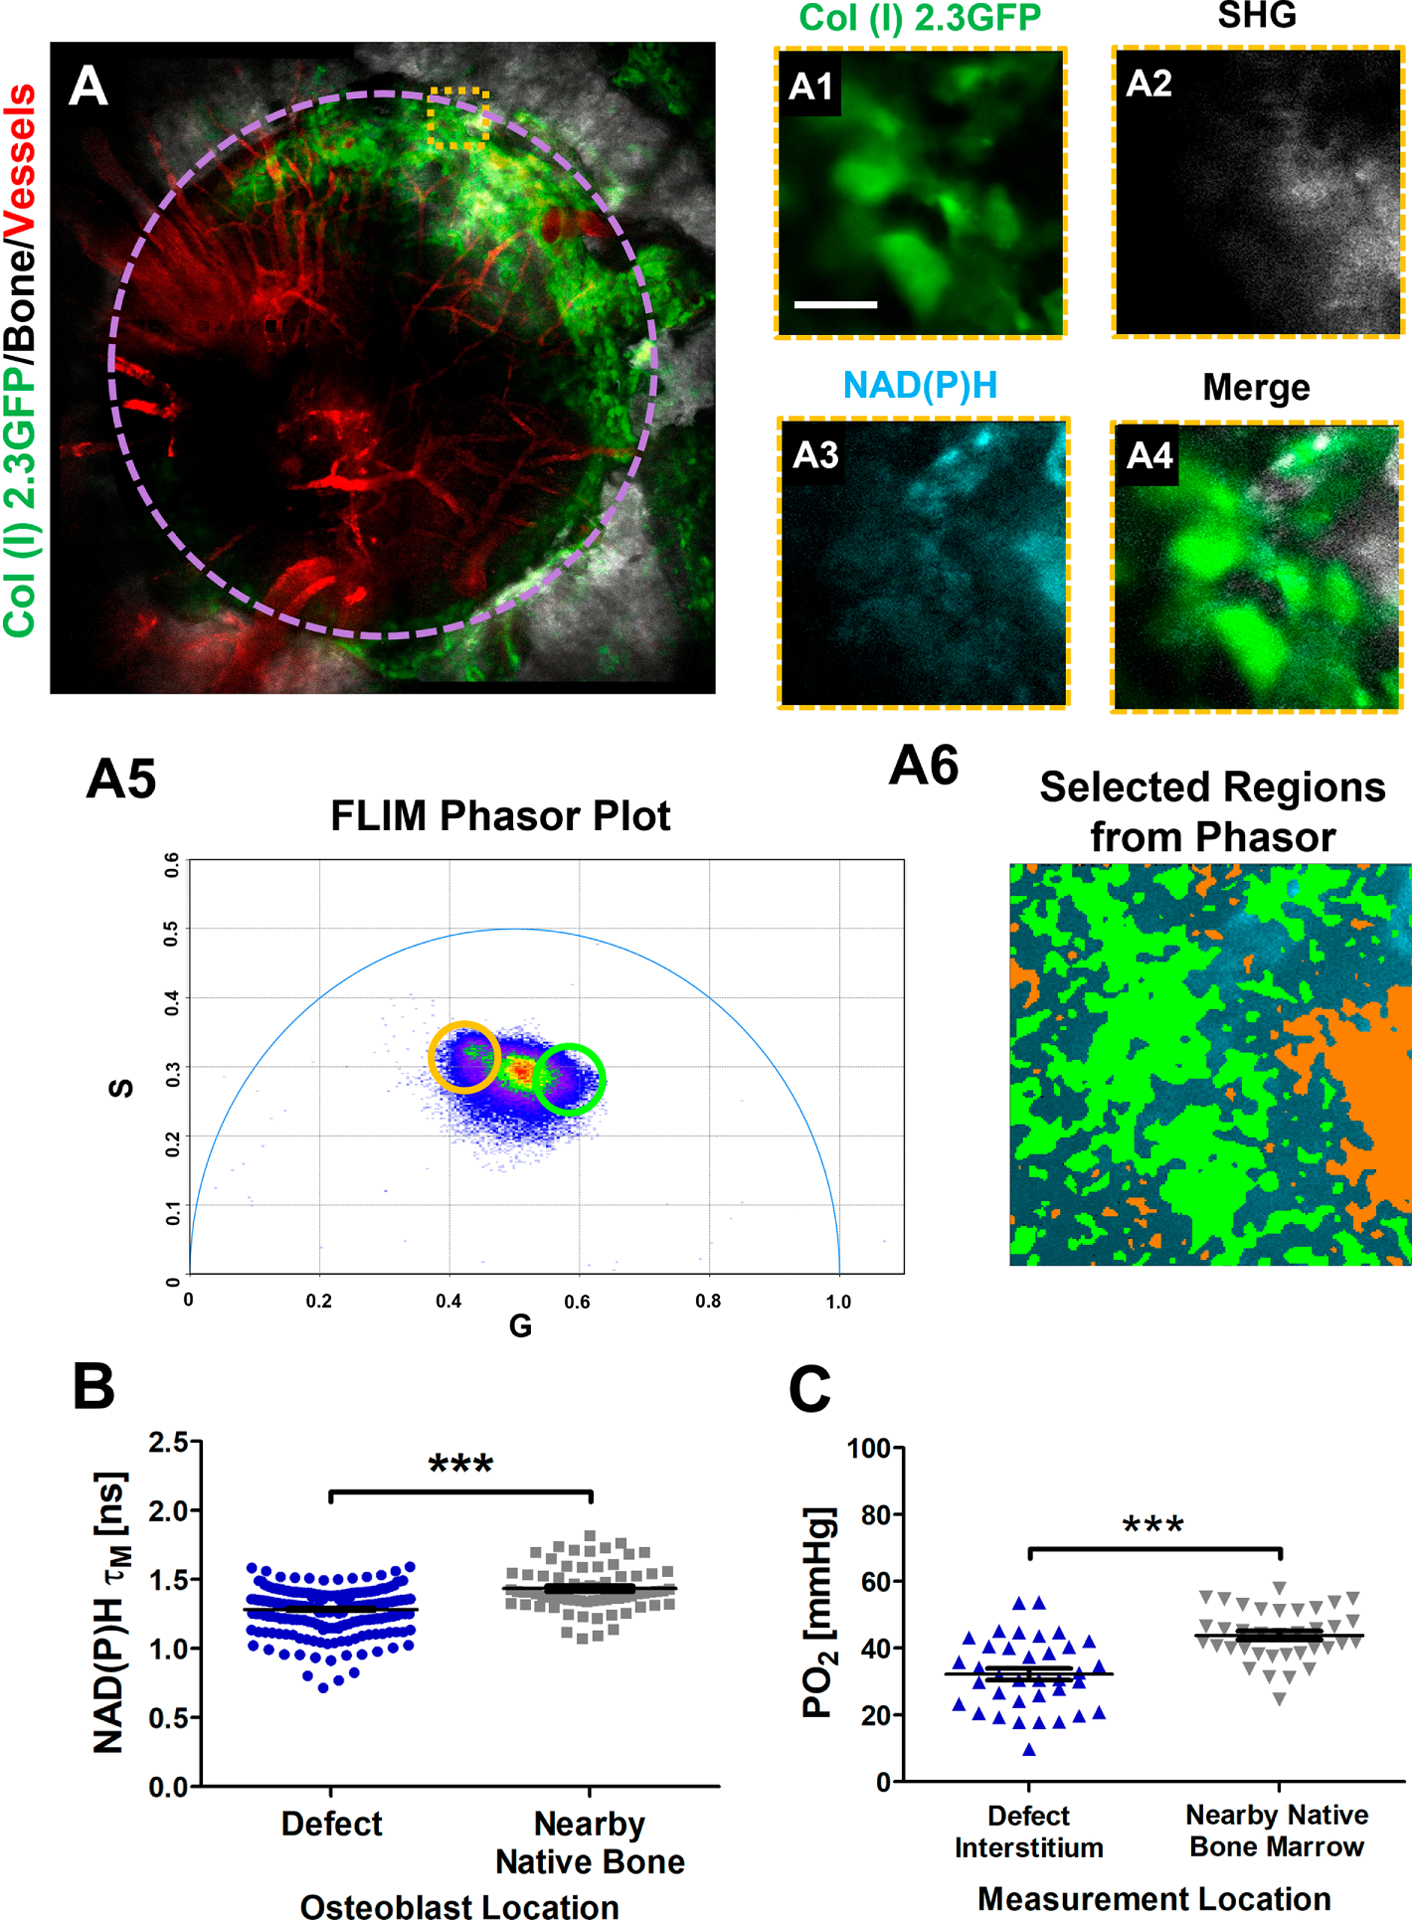
Fig. 7. NAD(P)H FLIM of osteoblasts within healing defect or nearby native bone of Col (I) 2.3GFP mice.

MPLSM of a 1 mm defect performed 18 days after surgery (A). Representative images of native bone illustrate bone/SHG (white), osteoblasts (green), and vasculature (red) with highlighted region where NAD(P)H FLIM was performed on individual cells (A1–4) [scale bar = 10 μm]. Corresponding phasor plot of the region shows a distribution of points (A5) where selected regions from the phasor demonstrate separable species among collagen (highlighted orange) and GFP+ osteoblasts (highlighted green) (A6). Calculated NAD(P)H τM of GFP+ osteoblasts within the healing defect as well as the nearby uninjured native bone (B) as well as pO2 within measured regions (C). [N≈37 cells for NAD(P)H τM measurements and N≈9 pO2 point measurements in each of 4 mice; ***, p<0.001; Student’s t-Test]
