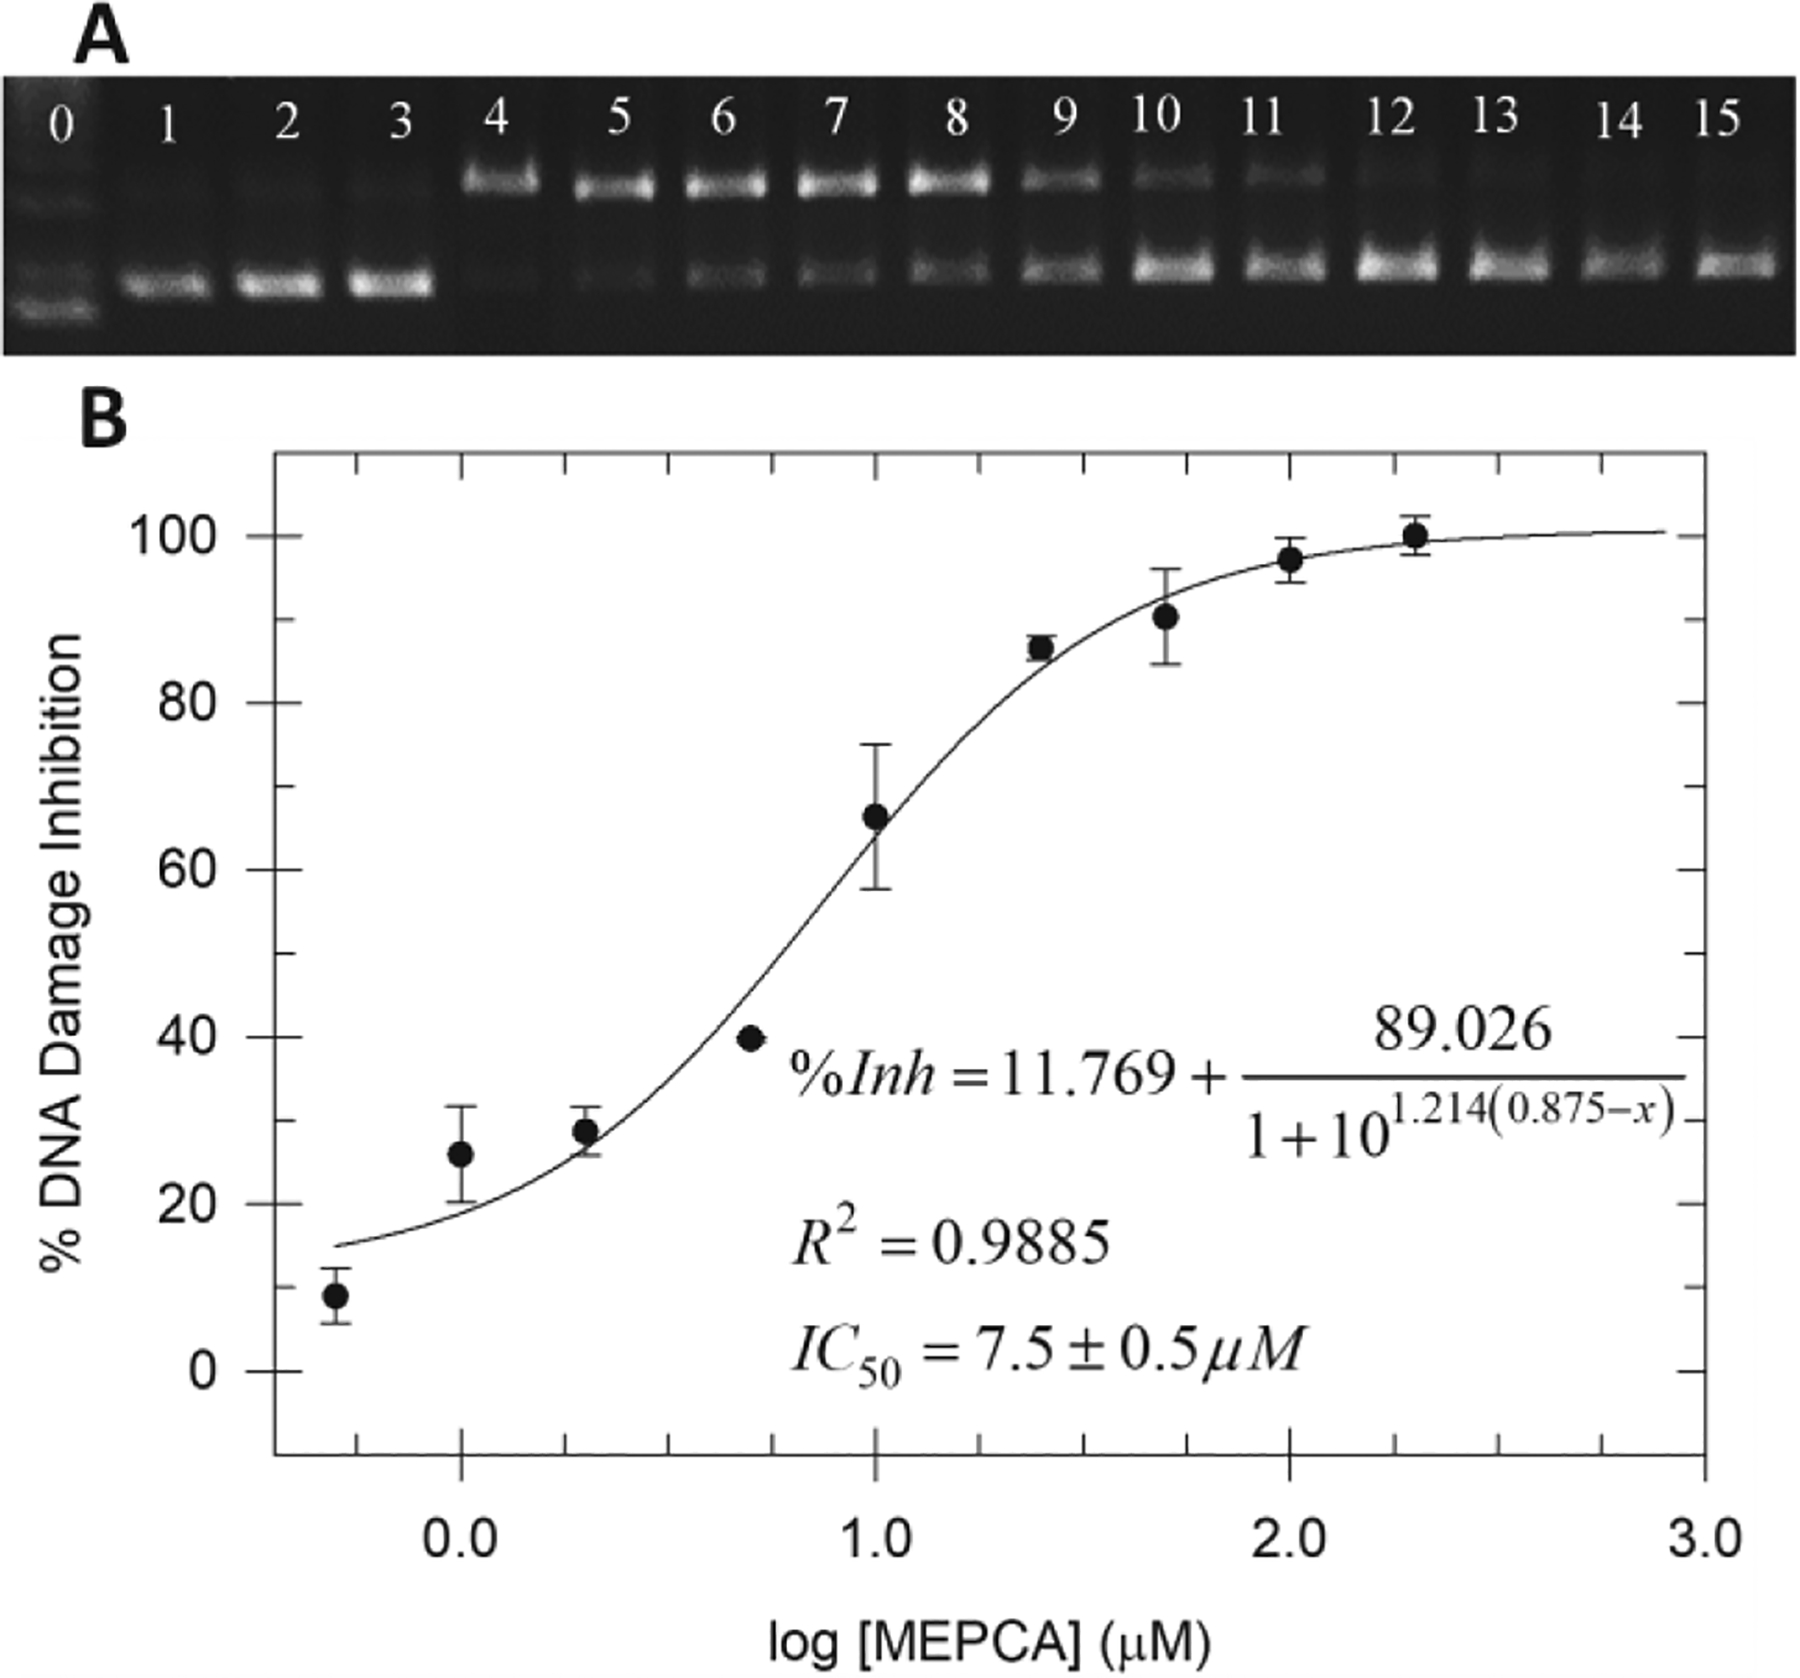
Figure 2.

A) Gel electrophoresis image of plasmid DNA treated with NPCuO (500 μM), H2O2 (50 μM), and MEPCA (0.5–800 μM) at pH 7 (MOPS buffer) for 150 min. Lane 0: 1 kb molecular weight ladder; lane 1: plasmid (p); lane 2: p + H2O2 (50 μM); lane 3: p + MEPCA (800 μM); lane 4: p + NPCuO (500 μM) + H2O2 (50 μM); lanes 5–15: p + NPCuO (500 μM) + and H2O2 (50 μM) + increasing concentrations of MEPCA (0.5, 1, 2, 5, 10, 25, 50, 100, 200, 400, and 800 μM, respectively). Damaged (nicked) plasmid DNA is in the top band, undamaged (supercoiled) DNA is in the bottom band, and the brightest band in lane 0, just below the undamaged DNA band, is the 3 kb DNA marker. B) Percentage of DNA damage inhibition with respect to MEPCA concentration in the presence of NPCuO and H2O2 fit with a sigmoidal dose-response curve.
