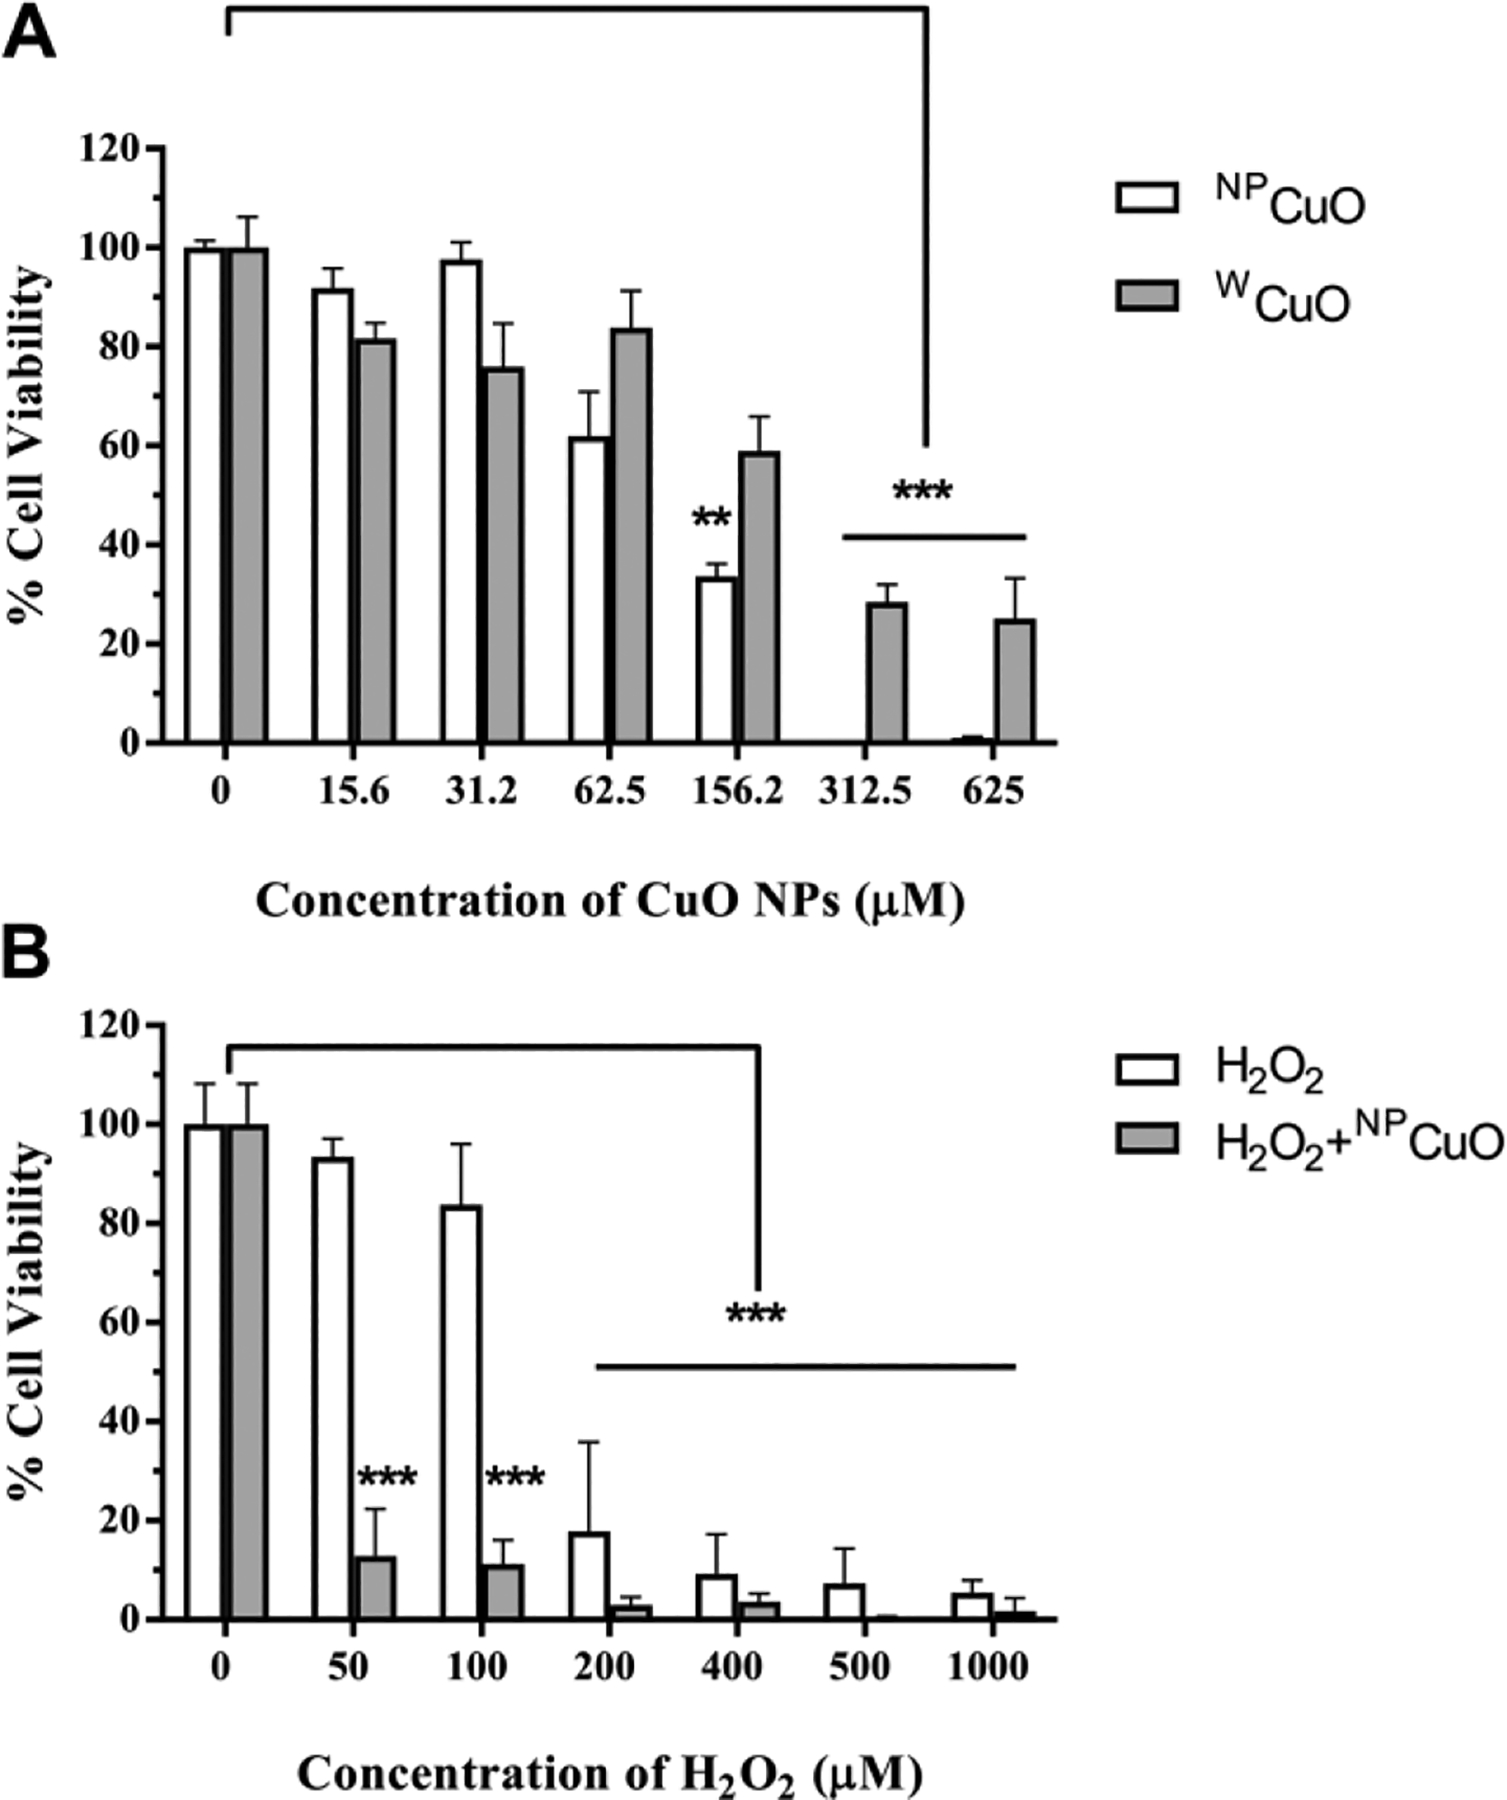
Figure 6.

L929 cell viability measured with the MTS assay after exposure to different conditions: cell viability after exposure to A) different concentrations of NPCuO or wCuO nanoparticle suspensions for 24 h for NPCuO or wCuO concentrations from 15.6–625 μM and B) cell viability after 24 h exposure to NPCuO (62.5 μM) and varying H2O2 concentrations (50–1000 μM). Data are expressed as means ± standard deviations (n = 4); **p-value <0.01 and ***p-value <0.001.
