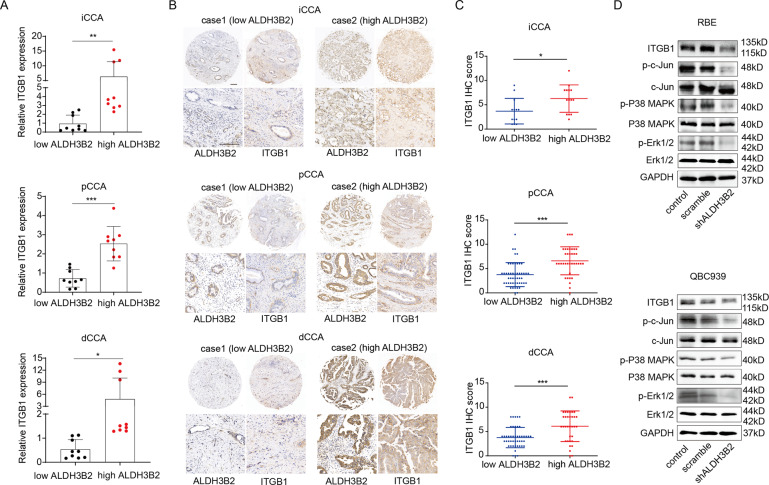
Fig. 5. ALDH3B2 regulates the expression of ITGB1, and knockdown of ALDH3B2 inhibits ALDH3B2 downstream signaling pathway.
A Relative mRNA expression of ITGB1 in high and low ALDH3B2 mRNA level iCCA (left), pCCA (middle) and dCCA (right) tissues (n = 6 for each CCA). ITGB1 was quantified by qRT-PCR. The results were analyzed using the 2−ΔΔCT method with GAPDH as a reference gene. Statistical significance between groups was assessed using the Student t-test. ** represents p < 0.01, *** represents p < 0.001. B Typical images of immunostaining of ALDH3B2 and ITGB1 in tissue microarrays of iCCA and Case 1 (left) showed that patients with low-density staining of ALDH3B2 also presented with low-density staining of ITGB1. In contrast, patient Case 2 (right) showed that patients with low-density staining of ALDH3B2 also presented low-density staining of ITGB1. C Statistical analysis of the correlation between the expression of ALDH3B2 and ITGB1 in iCCA (upper), pCCA (middle), or dCCA (lower). Expression of ITGB1 and ALDH3B2 was determined by IHC score, and the data were analyzed by Student’s t test. Patients with high ALDH3B2 expression have relatively high expression of ITGB1. D Western blot analysis of the expression of ITGB1 and the phosphorylation level of its downstream signaling pathway after ALDH3B2 knockdown in RBE cells (upper) and QBC939 cells (lower).

