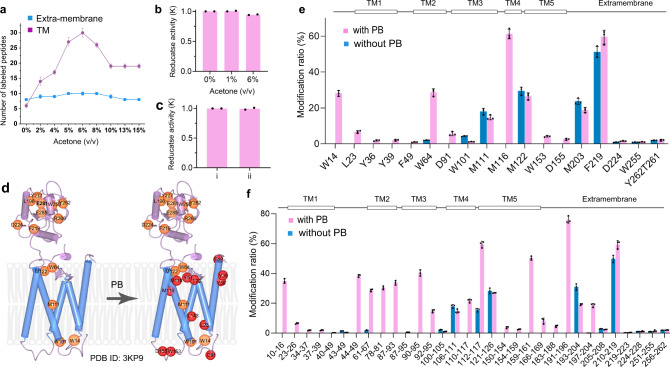
Fig. 2. NanoPOMP performance on VKOR.
a The number of labeled peptides for the extra-membrane and TM regions of VKOR (PDB ID: 3KP940) as a function of the amount of acetone (blue-extra-membrane; purple-TM) (n = 3 independent experiments per group, data are presented as mean values ± SD). b Enzyme activity of VKOR in liposome in presence of different amount of acetone (n = 2 independent experiments per group, data are presented as mean values and dots represent the two corresponding individual repeats). c Enzyme activity of VKOR in liposome (i) without TiO2 NPs, and (ii) with TiO2 NPs. n = 2 independent experiments per group, data are presented as mean values and dots represent the two corresponding individual repeats. d Cartoon diagram showing sites labeled by NanoPOMP. Red circles represent modified sites in the TM with PB reaction, and orange circles represent those without PB. e Residue-level modification ratios upon irradiation of TiO2 NPs with and without the PB reaction (purple-with PB; blue-without PB). n = 3 independent experiments per group, data are presented as mean values ± SD and dots represent the corresponding individual repeats. f Modification ratios at peptide level (purple-with PB; blue-without PB). n = 3 independent experiments per group, data are presented as mean values ± SD and dots represent the corresponding individual repeats. Source data are provided as a Source Data file.

