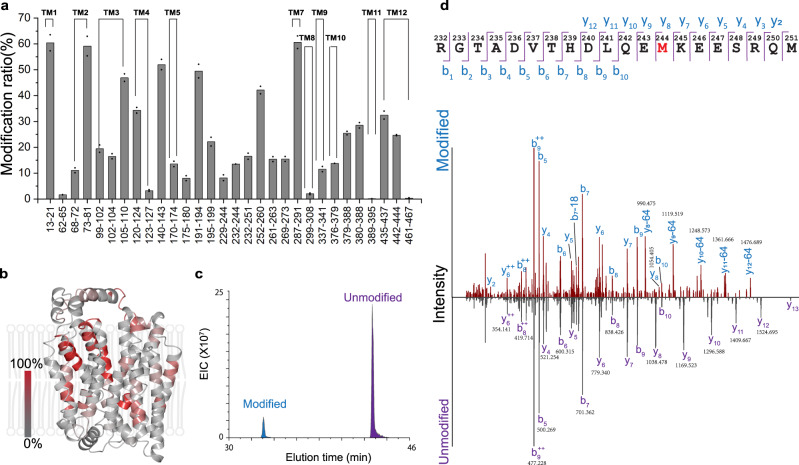
Fig. 3. NanoPOMP of hGLUT1 in liposome.
a Modification ratios at the peptide level. n = 2 independent experiments were repeated, two technical replicates (injections) were conducted for each individual sample. Data are presented as mean values of two biological repeats and dots represent the two corresponding biologically repeats. b Heat map (shaded in red) of the modification extents at the peptide level. c Extracted ion chromatogram of modified and unmodified representative peptide 232–251. d CID product-ion (MS2) spectra of modified and unmodified peptide 232–251. Source data are provided as a Source Data file.

