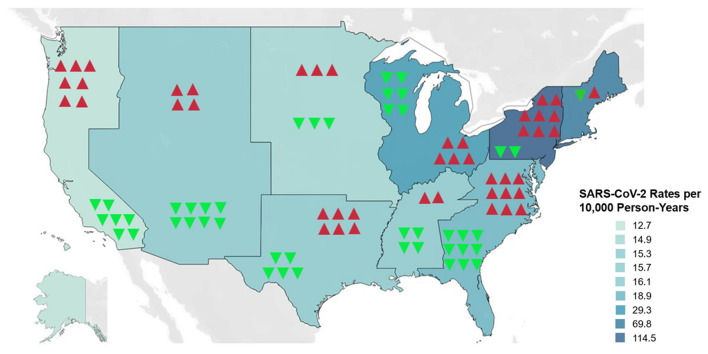
Figure 2.
US Census Divisions ranked according to rate differences for NSTEMI and Cardiac Arrest. Blue-teal shading represents gradations scaled to unadjusted SARS-CoV-2 infection rates per 10,000 person-years between January 1, 2020 and April 30, 2020. Downward green arrows represent negative rate differences for NSTEMI. Upward red arrows represent positive rate differences for cardiac arrest. The number of arrows is proportional to the relative magnitude of the rate differences. NSTEMI non-ST-elevation myocardial infarction, SARS-CoV-2 severe acute respiratory syndrome coronavirus 2.

