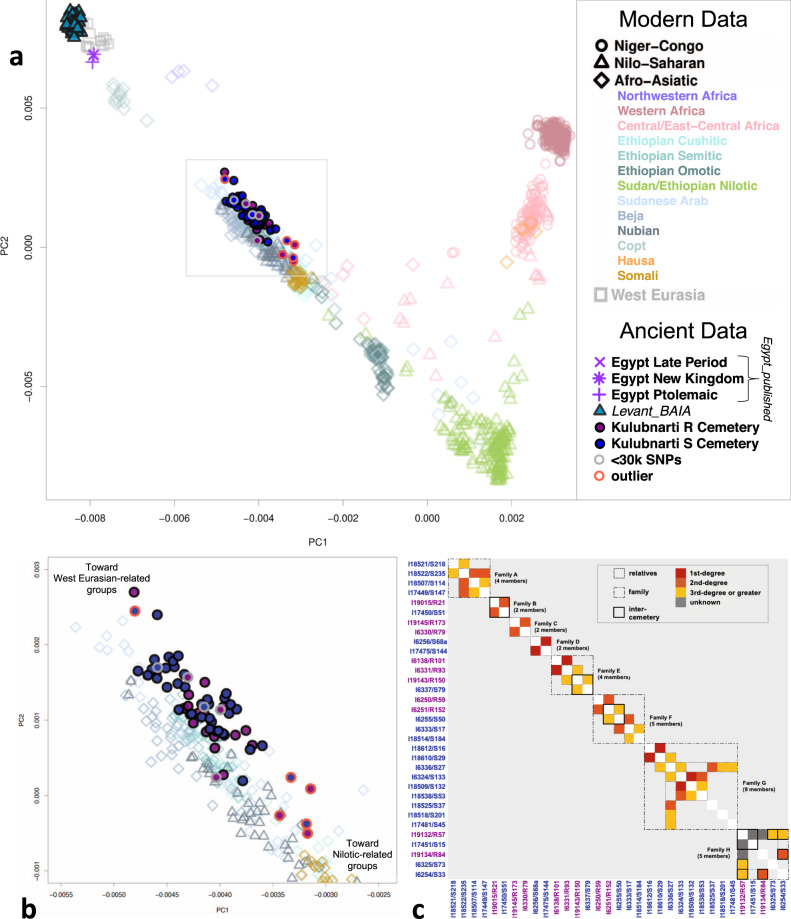
Fig. 2. Overview of population structure at Kulubnarti.
a PCA with Kulubnarti Nubians projected onto axes computed using present-day African and West Eurasian populations. Individuals from Kulubnarti are shown as solid maroon or blue circles (representing R and S cemetery individuals, respectively), significant genetic outliers are outlined in orange, individuals with <30 K SNPs are outlined in gray. The area within the gray box is featured in (b). See Supplementary Data 4 for all individuals shown. b PCA zoomed to show the spread of the Kulubnarti Nubians along the West Eurasian–Nilo-Saharan cline. c Pairwise genetic relatedness estimates for all individuals from Kulubnarti. R and S cemetery individuals labeled in blue and maroon, respectively. Degree of relatedness is indicated by square color, with solid outlines denoting relatives, dotted outlines denoting families, and thick outlines denoting inter-cemetery relatives. Relationships labeled as ‘unknown’ have too few overlapping SNPs to determine degree of relatedness. Data are in Supplementary Table 2.

