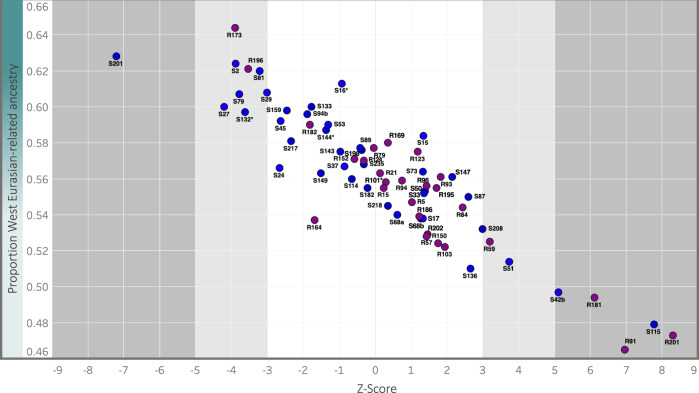
Fig. 3. Identifying genetic outliers at Kulubnarti.
We plot the Z-score for the statistic f4(Nilotic_Test, WestEurasia_Test; Individual, Kulubnarti_Without_Individual) for each individual at Kulubnarti (purple and blue circles represent R and S cemetery individuals, respectively) on the x-axis against the point estimate of West Eurasian-related ancestry on the y-axis (data in Supplementary Data 6). At |Z| > 5 (dark gray area), we consider individuals to be genetic outliers; individuals with |Z| > 3 (light gray area) were not considered outliers at the threshold set for this work. Asterisks (*) denote lower-coverage first-degree relatives of other individuals in the dataset.

