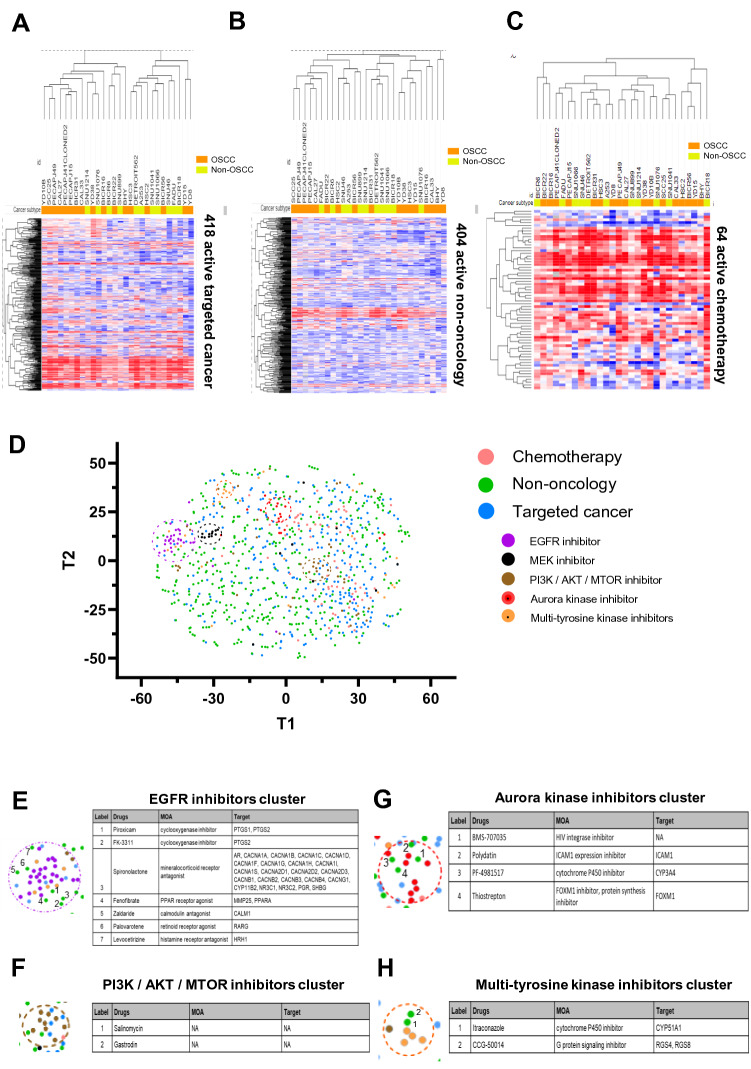
Figure 2.
Visualization of drug response data using heatmap with hierarchical clustering and t-distributed stochastic neighbour embedding (tsne) analysis. Heatmap of drug response data from the PRISM primary screen on the 28 HNSCC cell lines, for (A) 418 active targeted cancer compounds; (B) 404 active non-oncology compounds; (C) 64 active chemotherapies. Heatmaps were plotted using Morpheus tool: https://software.broadinstitute.org/morpheus/. (D) High-dimensional reduction of drug response data of 886 active drugs in HNSCC was performed using tsne analysis (perplexity 30, iterations 100). Targeted cancer compounds that belong to the same top MOA classes such as PI3K/AKT/MTOR inhibitors, EGFR inhibitors, MEK inhibitors and Aurora kinase inhibitors cluster closely together. While generally the non-oncology compounds are very scattered across the plot, reflecting the likely diversity of MOAs. (E)–(H) Non-oncology compounds that consistently fall into the (E) EGFR inhibitor cluster, (F) PI3K/AKT/MTOR inhibitor cluster, (G) Aurora kinase inhibitor cluster and (H) Multi-tyrosine kinase inhibitor clusters.

