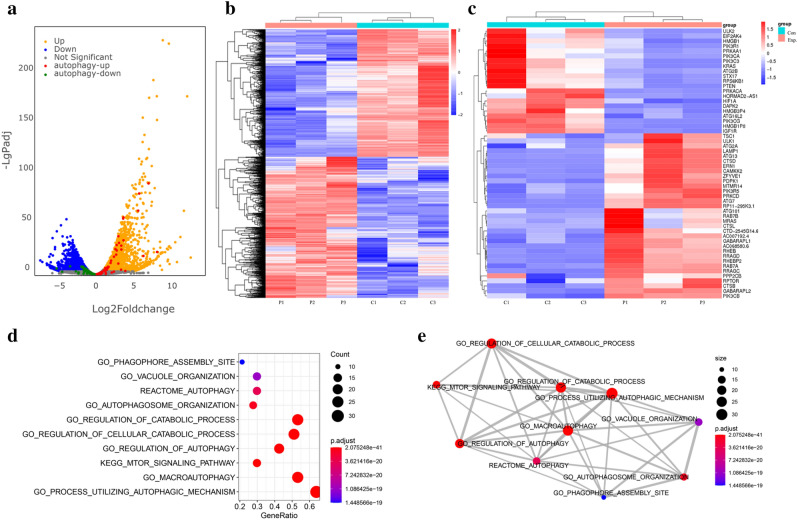
Figure 2.
RNA-seq analysis in spontaneous NETosis. Neutrophils from three healthy control children were isolated and divided into two groups, which were further divided into 1 and 6 h groups. Total RNA of cells was harvested at 1 h (control group) and 6 h (spontaneous NETosis group) and RNA-seq data was analyzed as described in the Methods. (a) Volcano map of differentially expressed genes between aging neutrophils and controls. Values are presented as log2. Up- and down-regulated genes are colored in orange and blue, respectively. Autophagy-up and -down related genes are colored in red and green, respectively. Hierarchical clustering with heat map showing the RNA levels of differentially expressed (b) genes associated with autophagy and (c) genes in aging neutrophils and controls. Genes are ranked based on their fold-change. (d, e) Gene set enrichment scatter plot and overlapping gene set network plot showed differentially expressed genes enriched in autophagy pathways.

