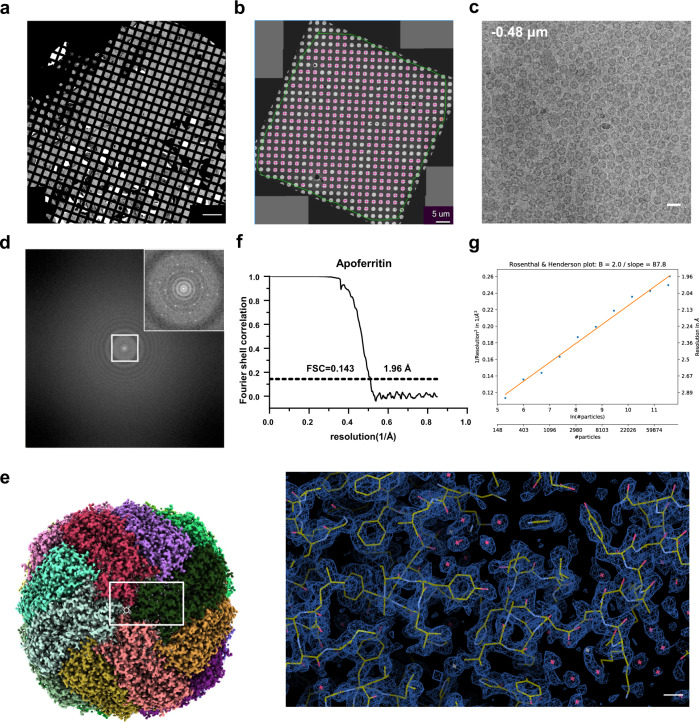
Fig. 2. Cryo-EM application of HFBI film using human apoferritin as a test sample.
a Cryo-EM montage micrograph (scale bar, 200 µm) of the HFBI film-covered ANTA foil grid with vitrified human apoferritin. b Cryo-EM montage micrograph (scale bar, 5 µm) of one square of the grid. The holes with good ice thickness and relatively low contamination for data collection are labelled in purple. c Representative cryo-EM micrograph of human apoferritin particles. Scale bar, 20 nm. d Power spectrum of the high magnification cryo-EM micrograph in (c). The central region is magnified (inset) and shows the diffraction spots of the HFBI film. e Cryo-EM map of human apoferritin at 1.96 Å resolution, and a representative region is magnified (right) with the fitted atomic model. Scale bar, 2 Å. f Gold standard FSC curve showing an overall resolution of 1.96 Å. g Rosenthal–Henderson plot with an estimated B-factor of 87.8 Å.

