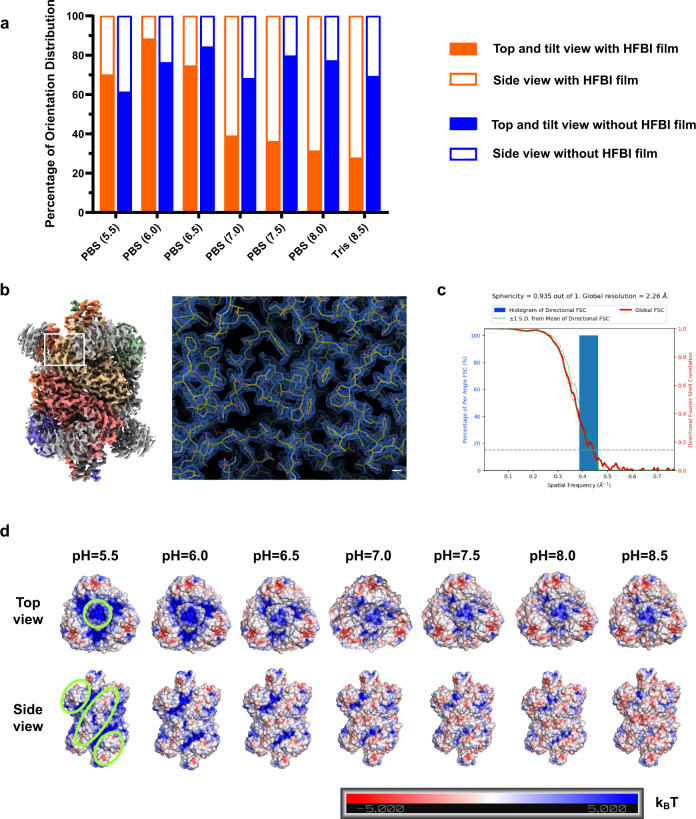
Fig. 5. Regulating particle orientation distribution by changing the buffer condition.
a The statistics of percentages of different GDH views in different buffer conditions. PBS phosphate-buffered saline. Tris, Tris buffer (20 mM Tris–HCl and 150 mM NaCl). The pH value of each buffer is shown in brackets. b The 2.26 Å resolution cryo-EM map of pH 7.5 buffered GDH that was solved using the HFBI film covered ANTA foil grid, and a representative region of the cryo-EM map is magnified (right) with the fitted atomic model. Scale bar, 2 Å. c 3D-FSC plot of cryo-EM reconstruction of pH 7.5 buffered GDH using the HFBI film covered ANTA foil grid. d The electrostatic potentials of GDH at different pH values are mapped onto its solvent-accessible surface. The electrostatic potentials are coloured from red (negative charge) to blue (positive charge) in the range of −5.0 to 5.0kBT. Green circles highlight the regions attached to the HFBI film at the corresponding views.

