Figure 2.
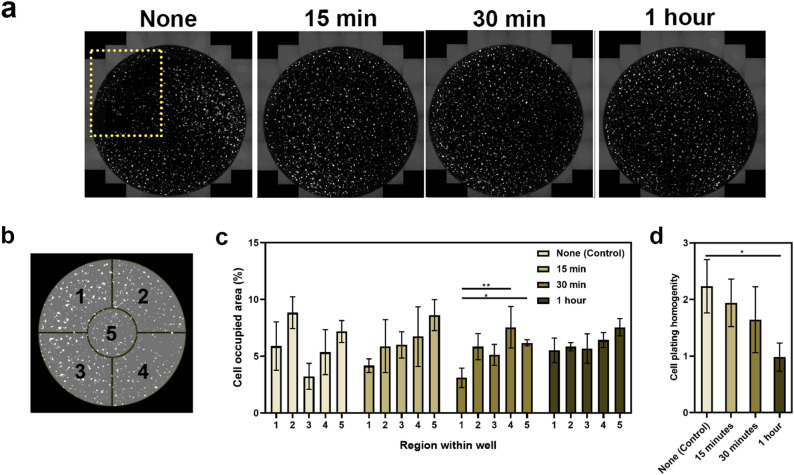
Different room temperature pre-incubation periods affect cell plating homogeneity across the well in 96-well plates. (a) Full well scan acquired using the full-well scan function on the EVOS FL Auto microscope with a ×10 objective lens. Yellow box indicates the region where cells are sparsely distributed. (b) Schematic illustration of well divisions into five regions for analysis. (c) Cell plating homogeneity was determined as the standard deviation between each region. This was used to evaluate the efficacy of pre-incubation for different time periods. Each bar represents the mean (n = 3) ± SD. (d) Cell plating homogeneity defined as the standard deviation between each region was used to evaluate the efficacy of pre-incubation for different time periods. Each bar represents the mean (n = 5) ± SD. A one-way ANOVA test and Tukey’s post-hoc analysis was performed to evaluate statistical significance where **p < 0.01 and *p < 0.05.

