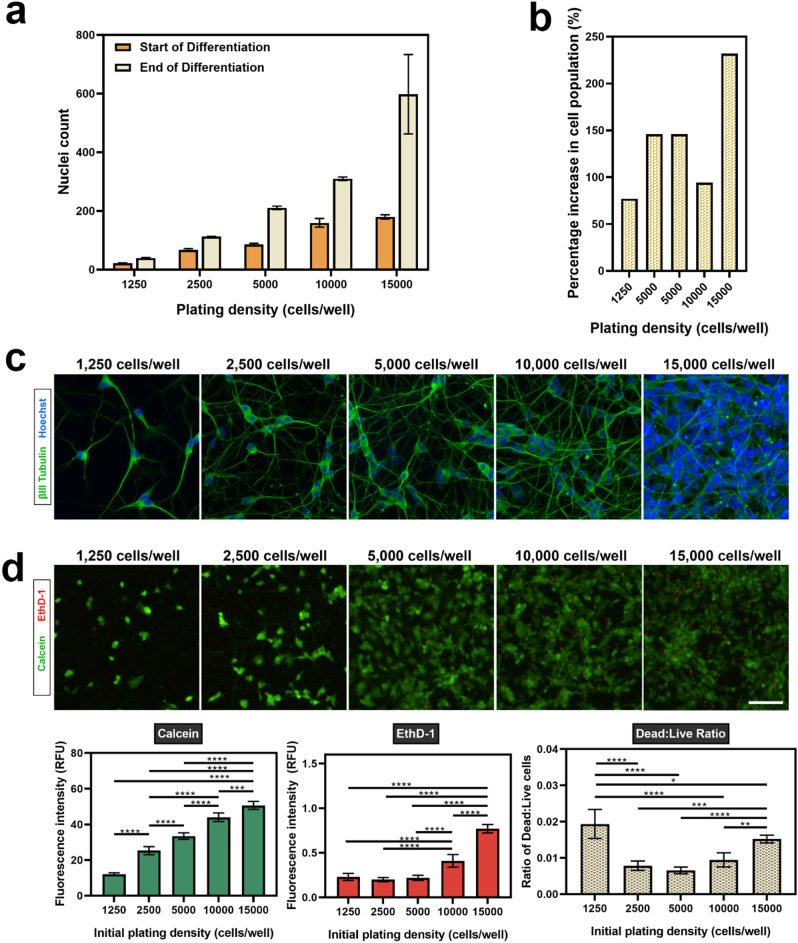
Figure 3.
Cell density of plated SH-SY5Y cells increases during the differentiation period. (a) The nuclei was counted in four regions across each well at day 1 (start) and day 11 (end) of differentiation. (b) Percentage increase in cell population was derived from the nuclei count at day 1 (start) and day 11 (end) of differentiation. Each data point represents the mean (n = 3) ± SD. (c) Representative images of terminally differentiated SH-SY5Y cells at varying initial plating densities. As cells proliferate in culture, initial plating densities impact neurite analysis after terminal differentiation. (d) The viability of terminally differentiated SH-SY5Y cells was evaluated using a LIVE/DEAD assay and fluorescence intensity measurements used to determine viability. Images were acquired using an EVOS FL Auto microscope at ×20 magnification (scale bar = 25 µm). βIII-tubulin images were acquired using the GFP filter (excitation 482/25 nm; emission 524/24 nm; exposure 110 ms), while Hoechst nuclei images were acquired using the DAPI filter (excitation 357/44 nm; emission 447/60 nm; exposure 19 ms). Each bar represents the mean (n = 5) ± SD. A one-way ANOVA test and Tukey’s post-hoc analysis was performed to evaluate statistical significance where ****p < 0.0001, ***p < 0.001, **p < 0.01 and *p < 0.05.

